Easy way to create a 3D map in QGIS
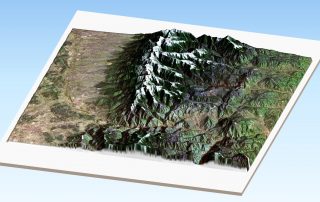
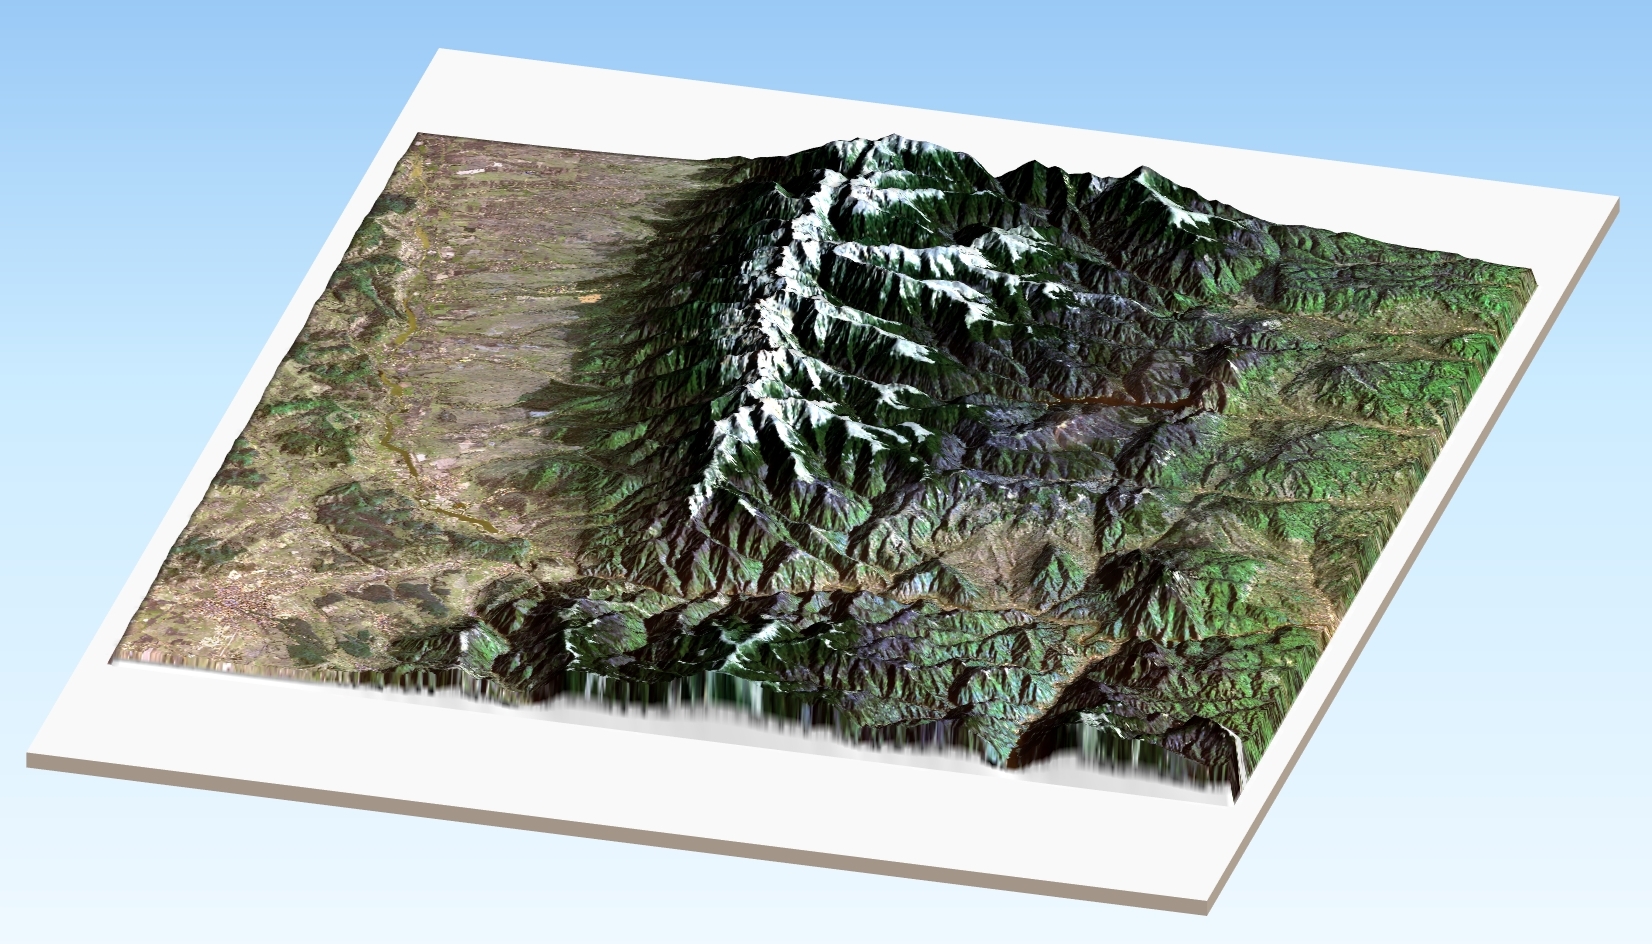
Now, you can create a 3D map easily in QGIS. For this exercise we will use a Digital Elevation Model, a hillshade and a Sentinel-2 satellite image. All of them clipped by the same limit. […]
Now, you can create a 3D map easily in QGIS. For this exercise we will use a Digital Elevation Model, a hillshade and a Sentinel-2 satellite image. All of them clipped by the same limit. […]
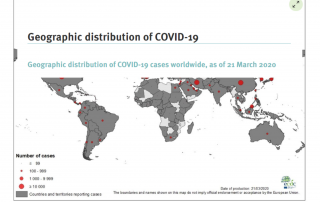
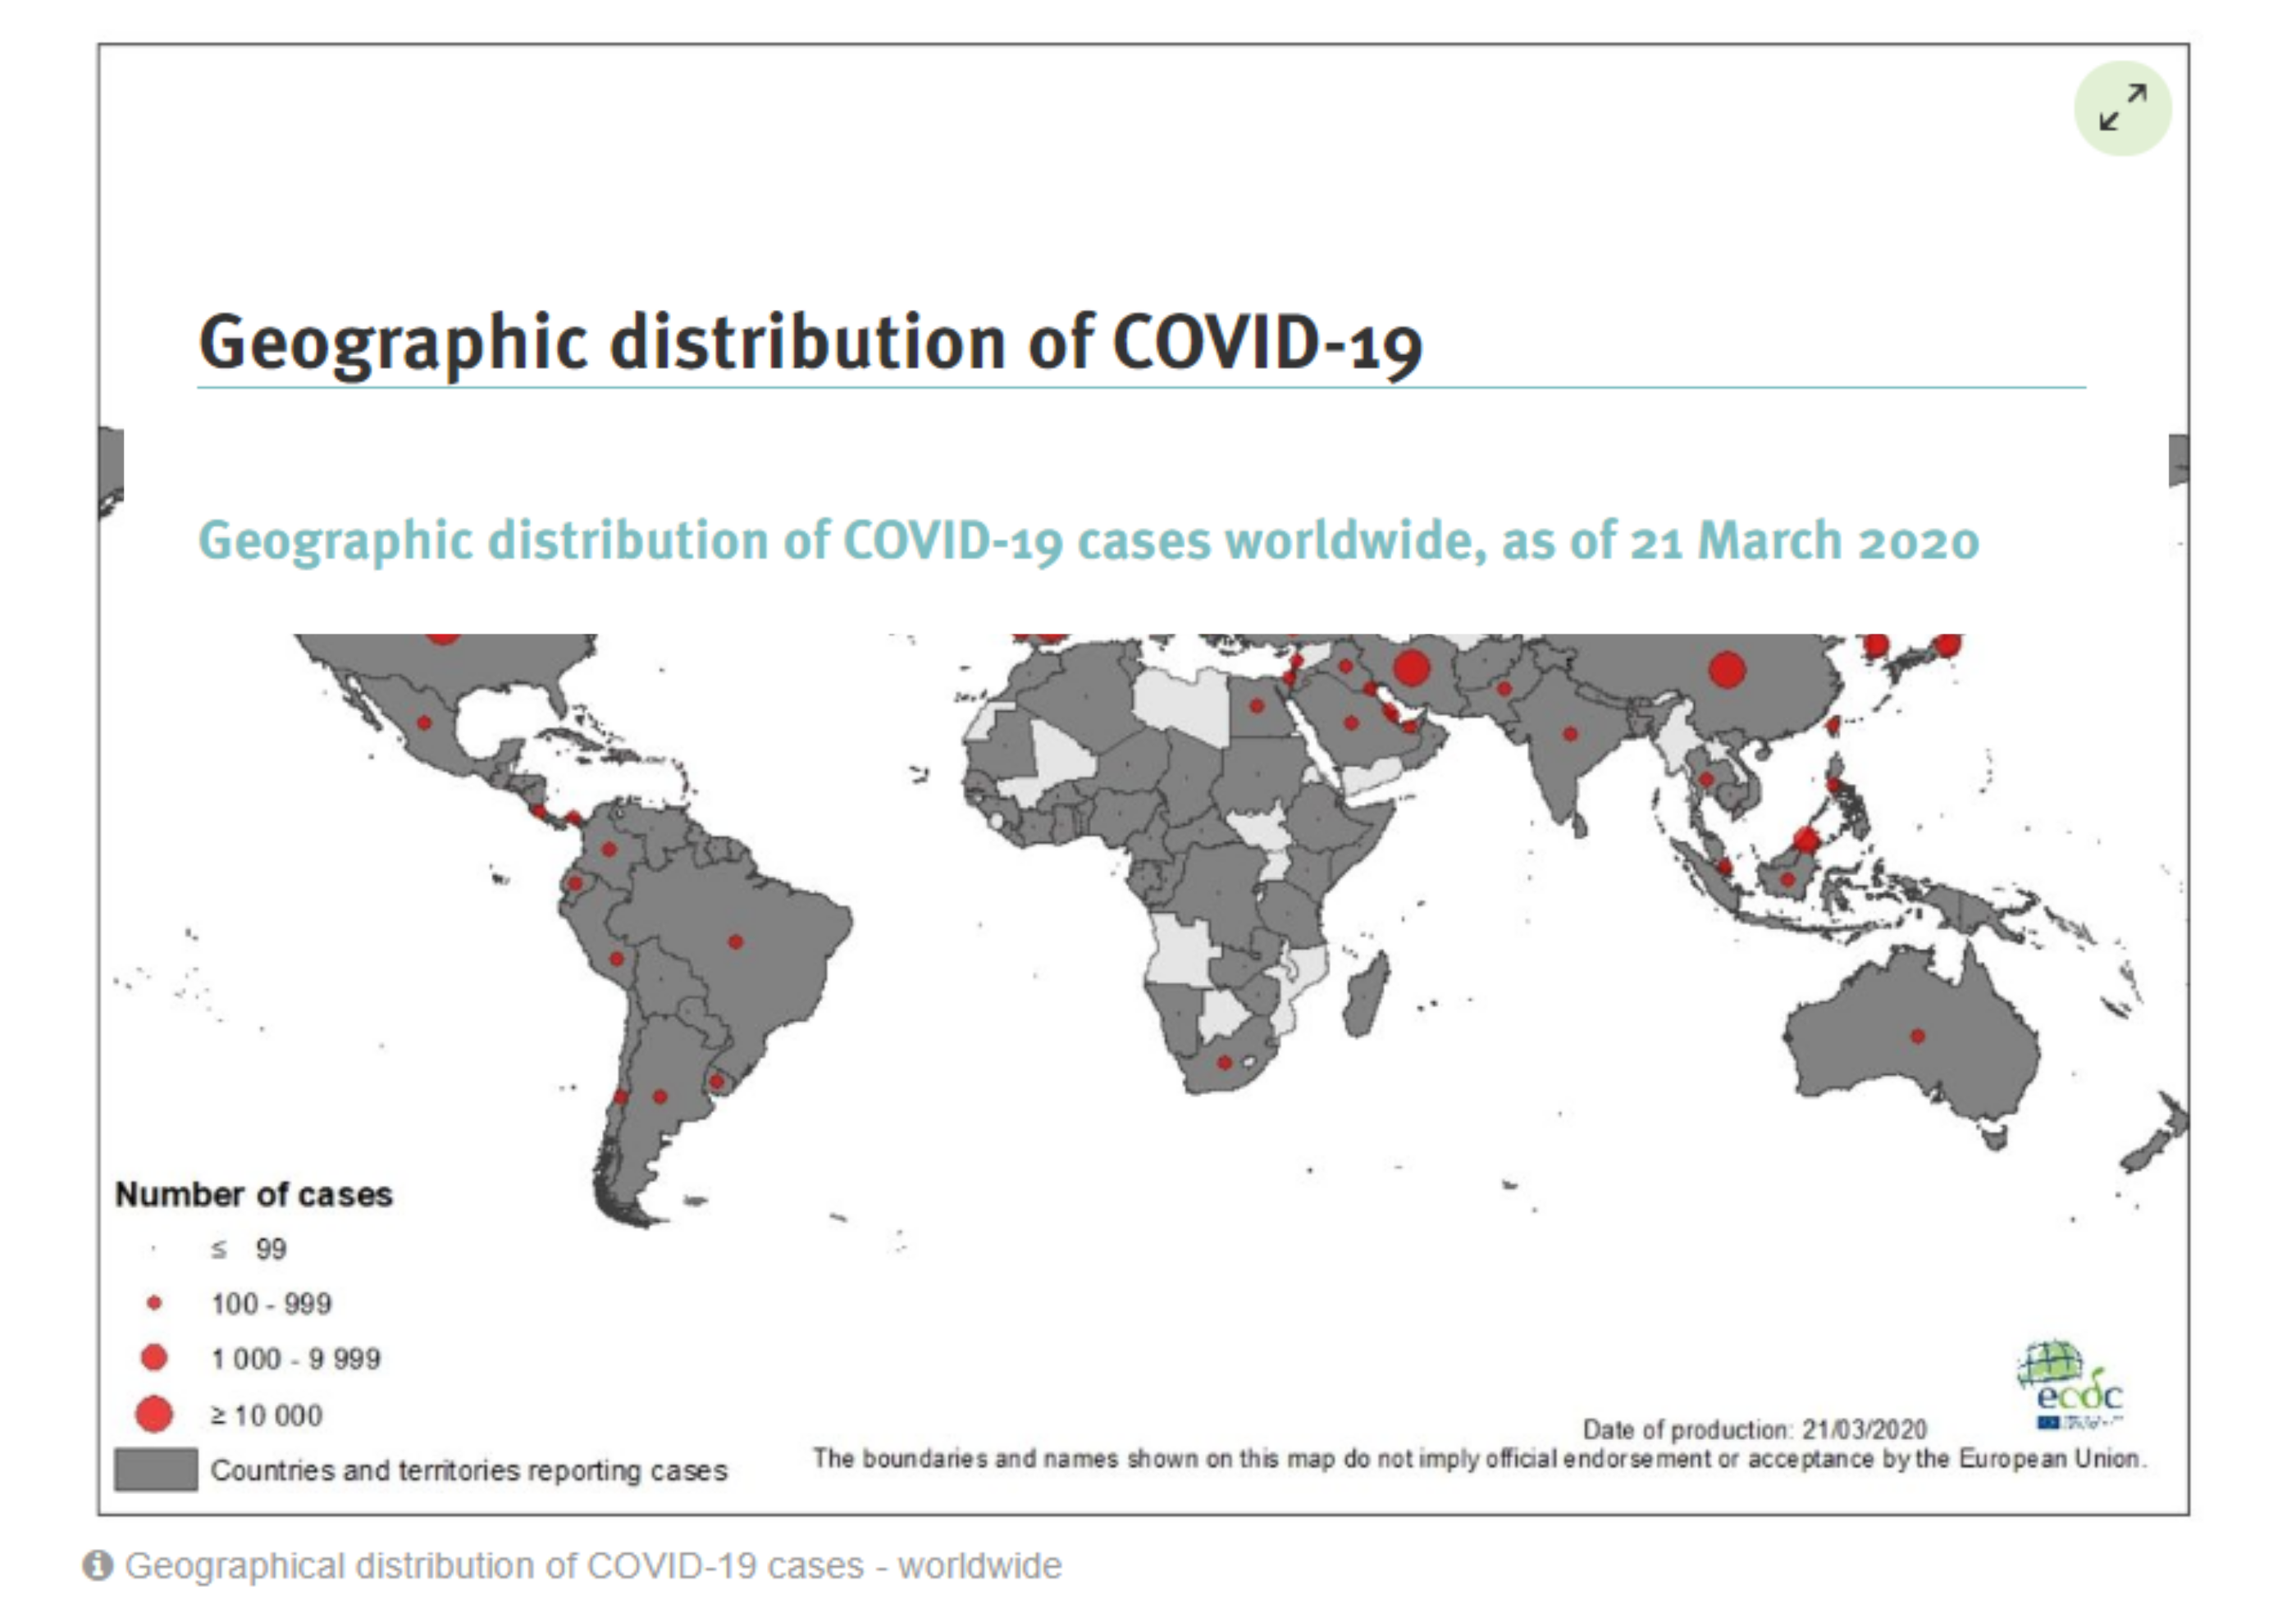
Digital maps serve as effective tools when it comes to managing emergency situations like epidemics. […]
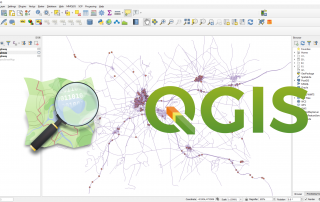
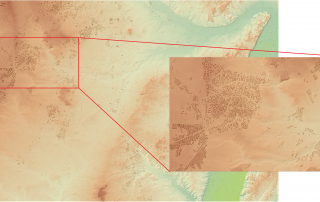
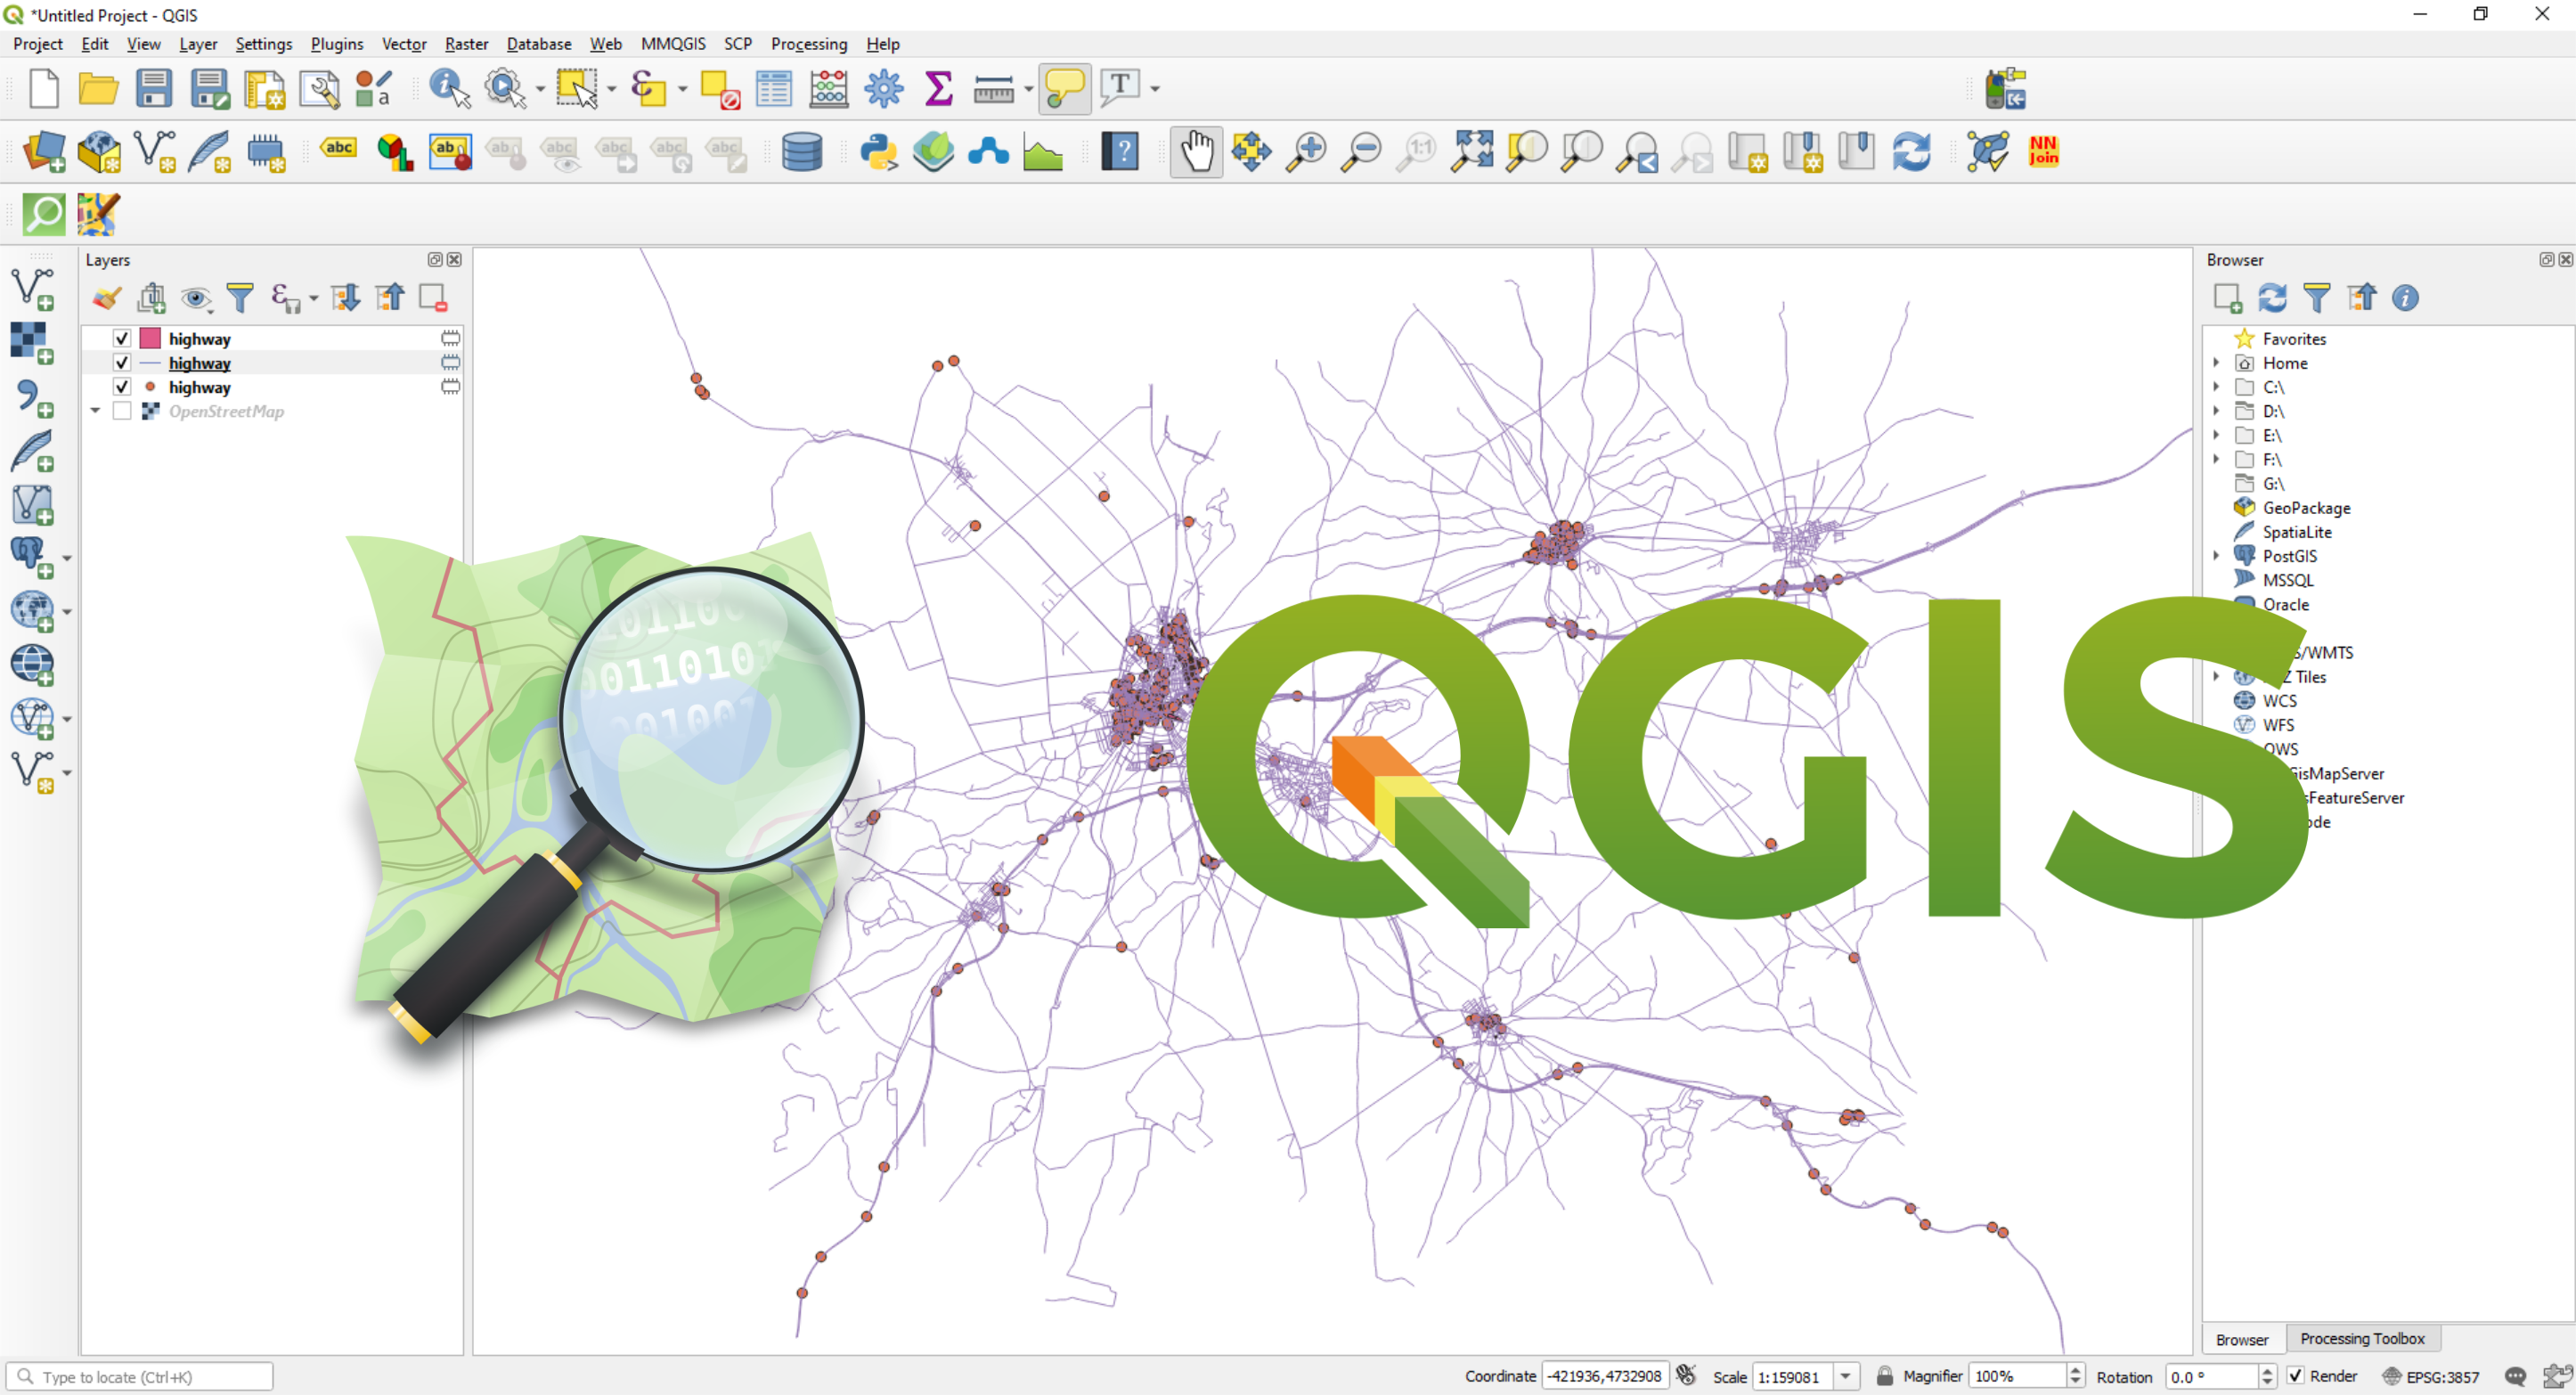
Sometimes when you find yourself in need for some spatial data like, roads, buildings, waterways, etc. you can check the OpenStreetMap Database. […]
OSGeo4W is a binary distribution of a broad set of open source geospatial software for Windows environments. OSGeo4W includes QGIS, GDAL/OGR, GRASS as well as many other packages. […]
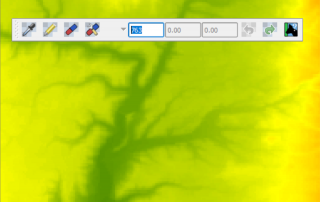
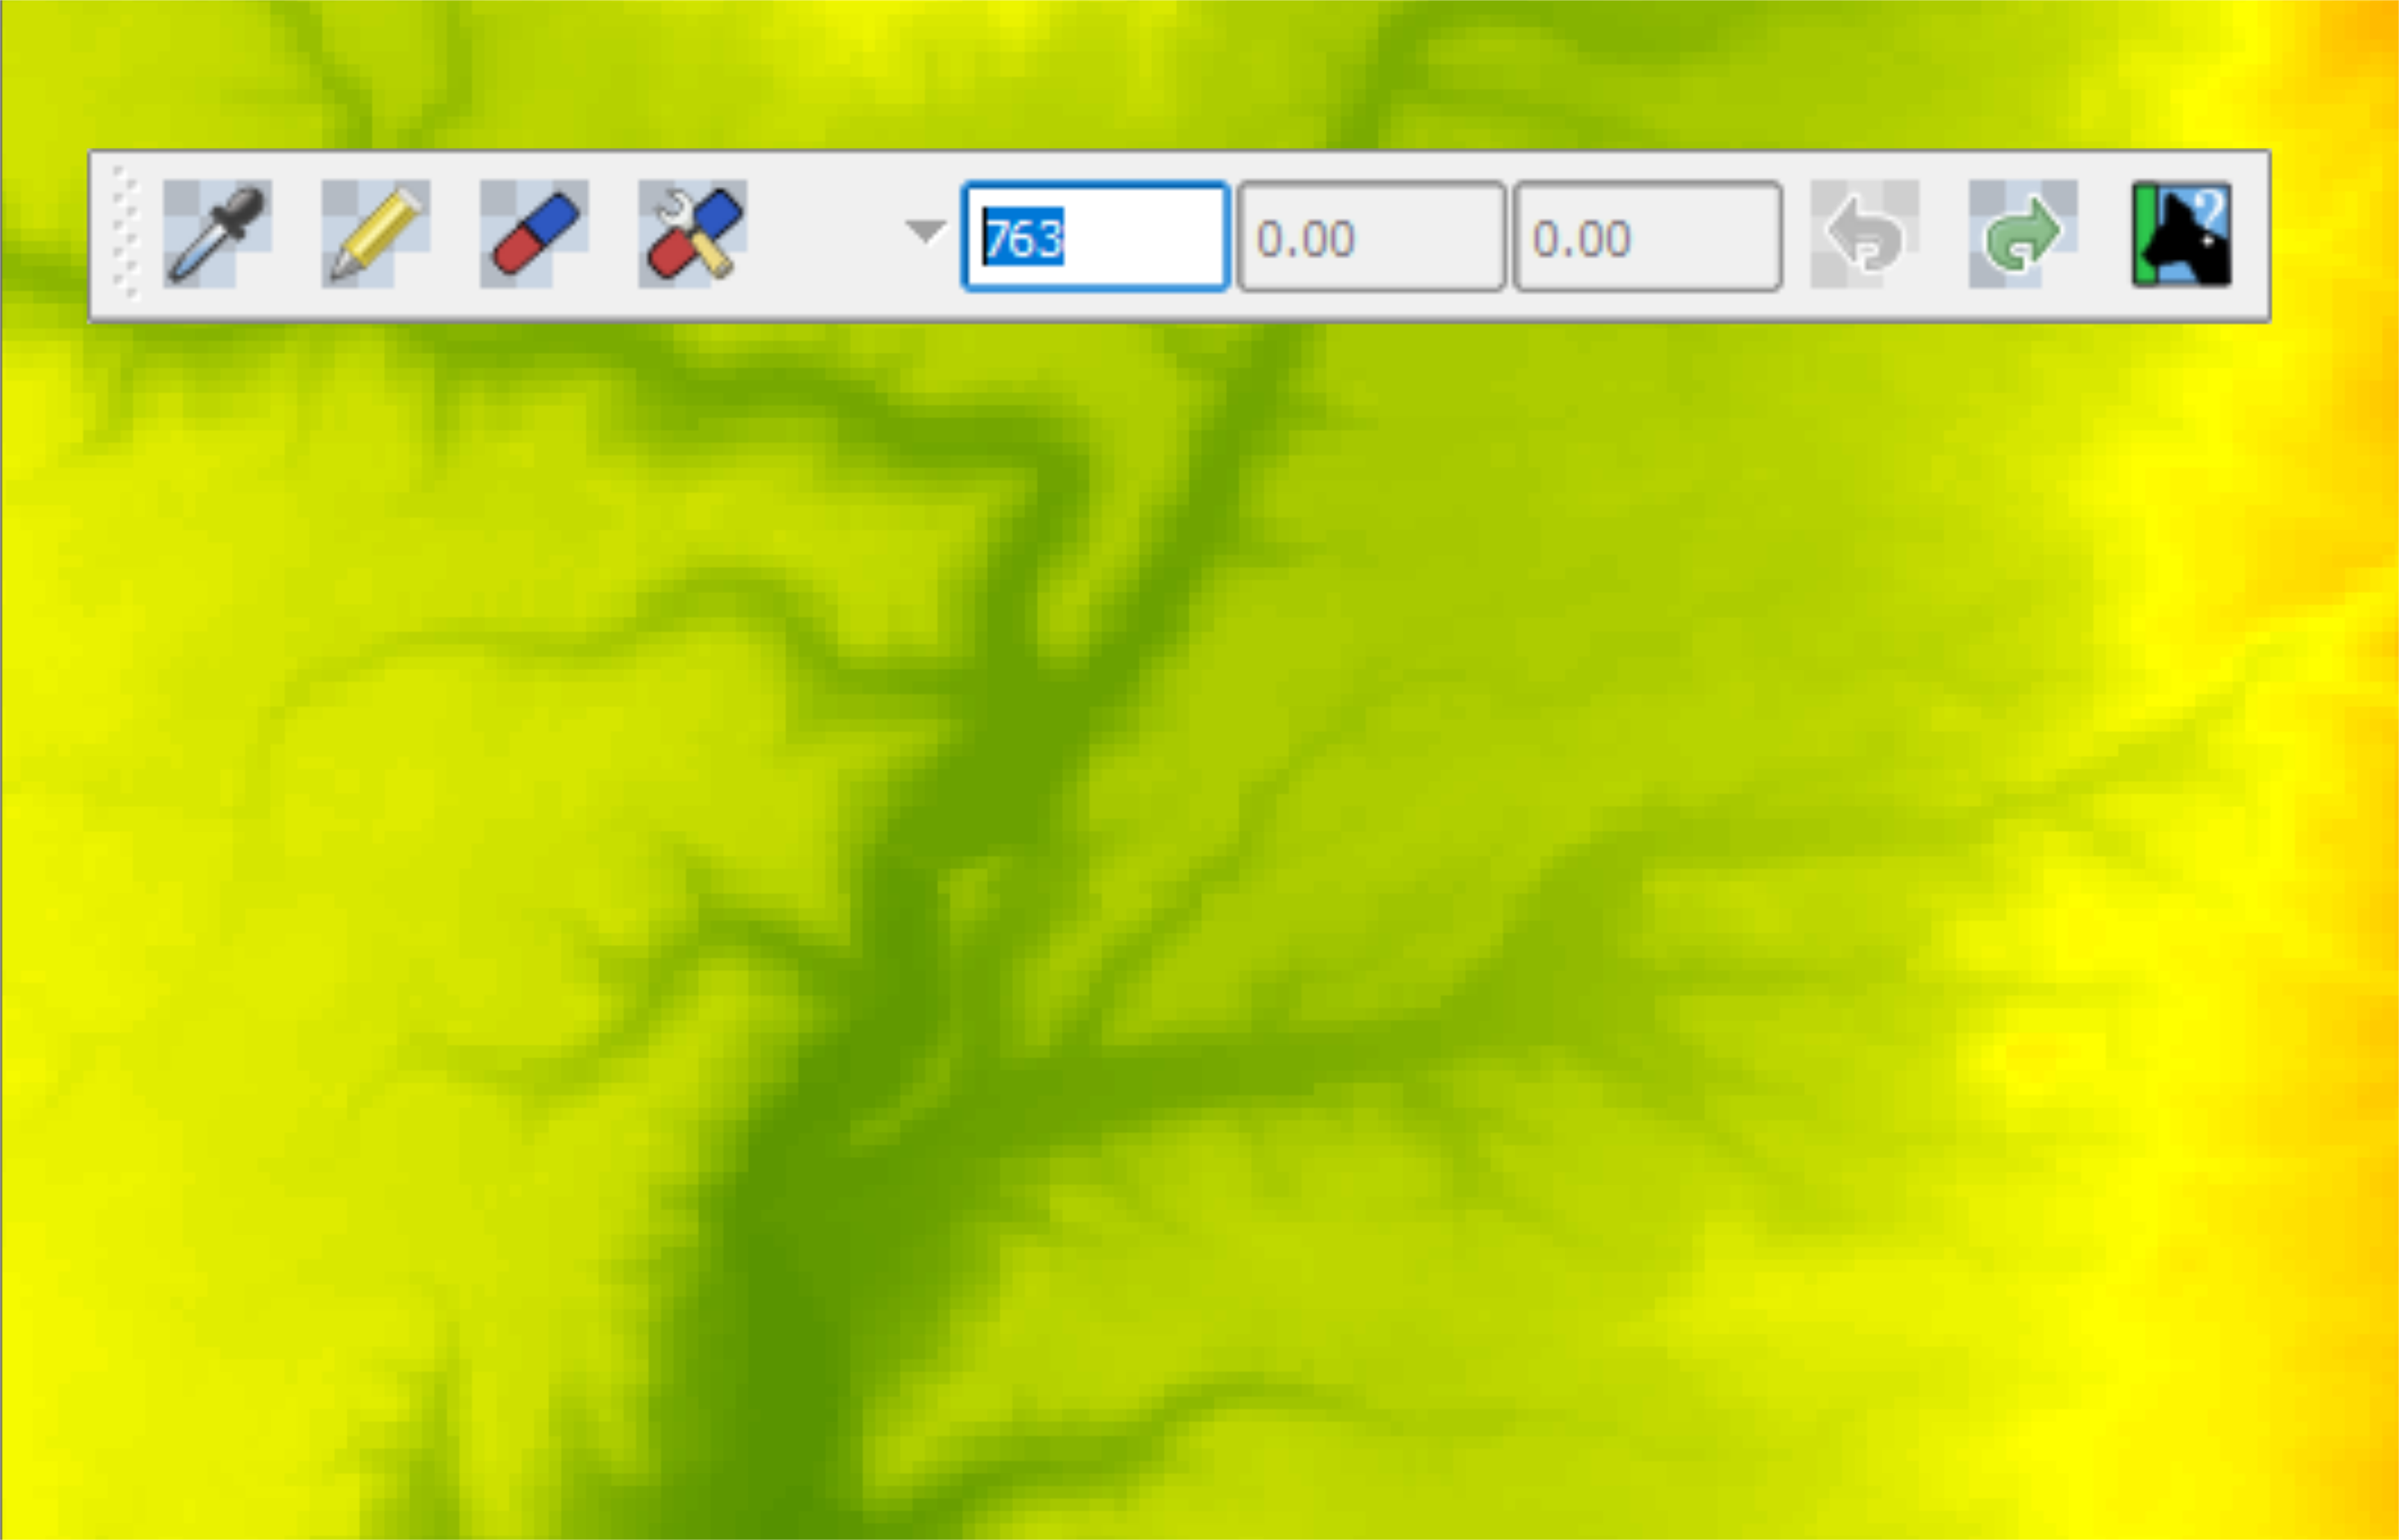
Maybe sometime you will need to edit some raster cells and change their values. Using the Serval QGIS Plugin you can do this. You can install this plugin by going to Plugins > Manage and Install Plugins and typing Serval in the search box. After the installation is done you can find the newly installed [...]
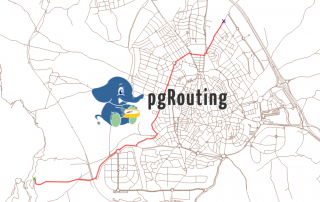
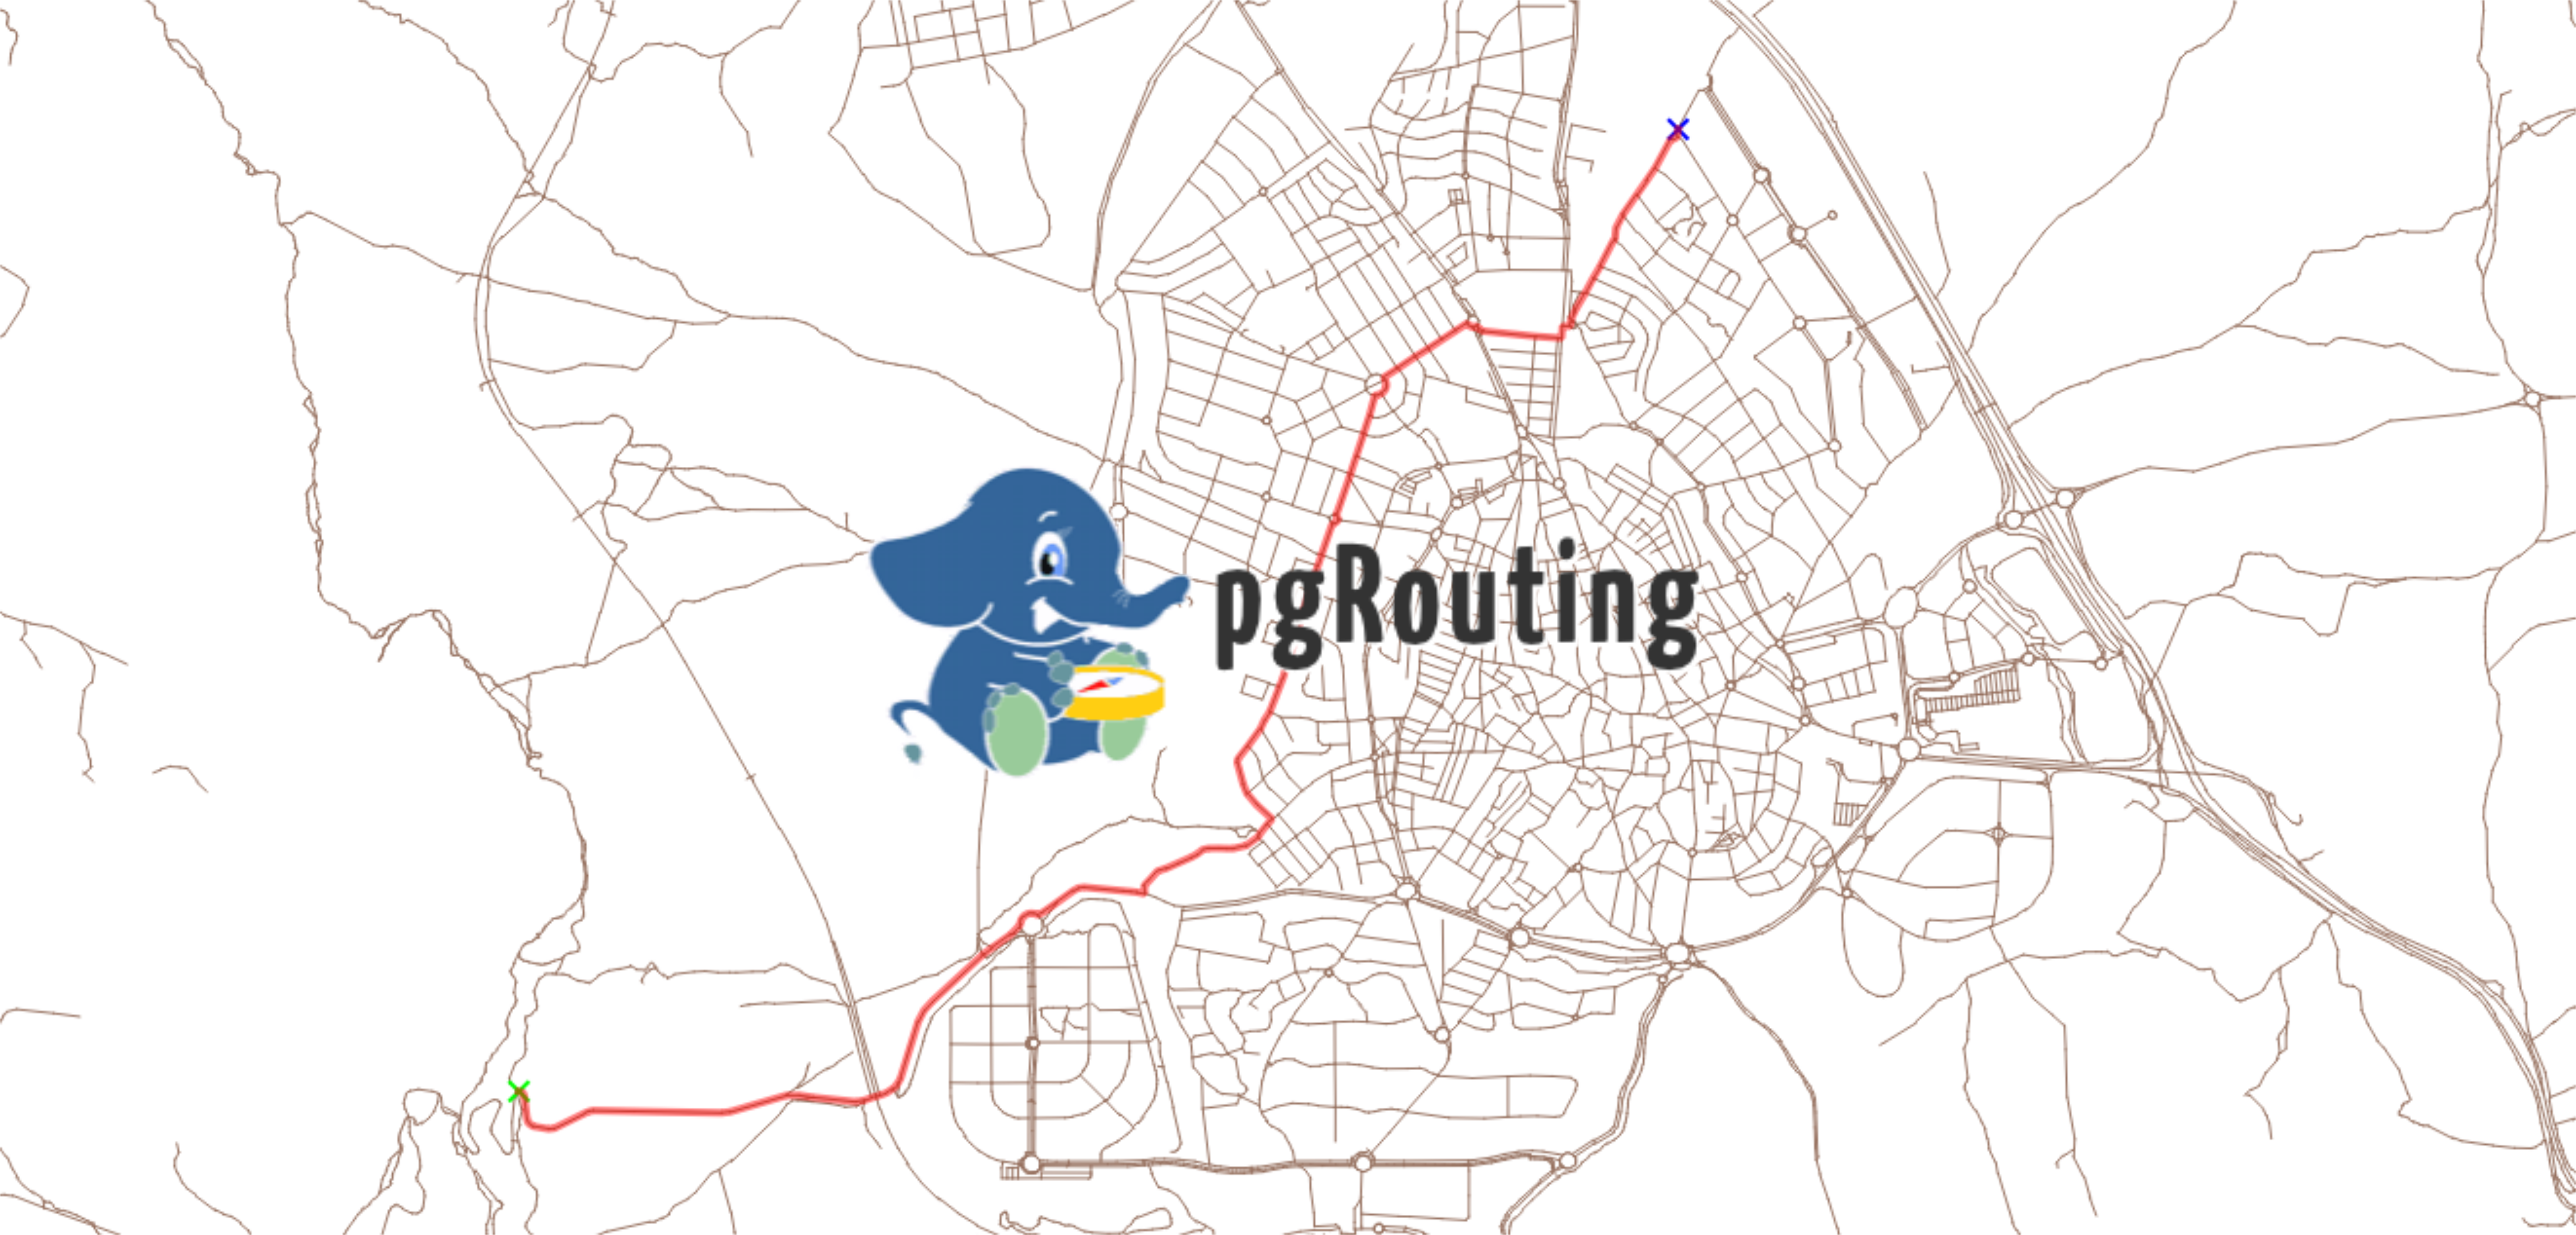
pgRouting is an extension of PostGIS (geospatial database), which in turn, is an extension of PostgreSQL database system. It adds routing capabilities and network analysis functionalities to the PostGIS geospatial database. You can perform different network analysis, shortest paths, driving distances, service areas on a topological corrected network. To be able to perform route analysis [...]
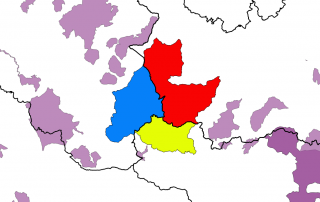
For this exercise please use QGIS version 2.18. Various vector layers and tables (OGR, SpatiaLite, PostGIS, MSSQL Spatial or Oracle Spatial) can be edited in QGIS. Before you start a editing session in QGIS, make sure you set the right snapping options (Snapping Tolerance and Search Radius). In QGIS you can find these options in [...]
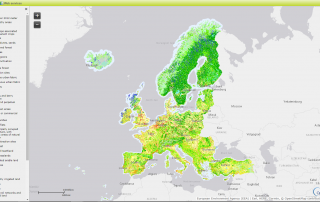
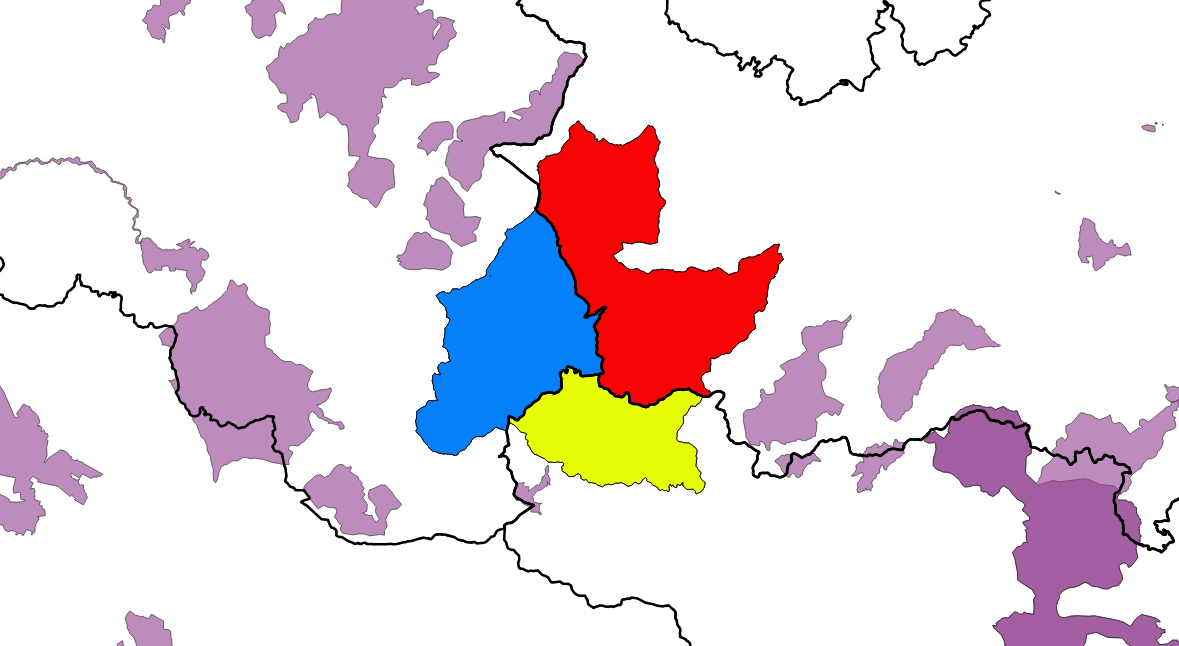
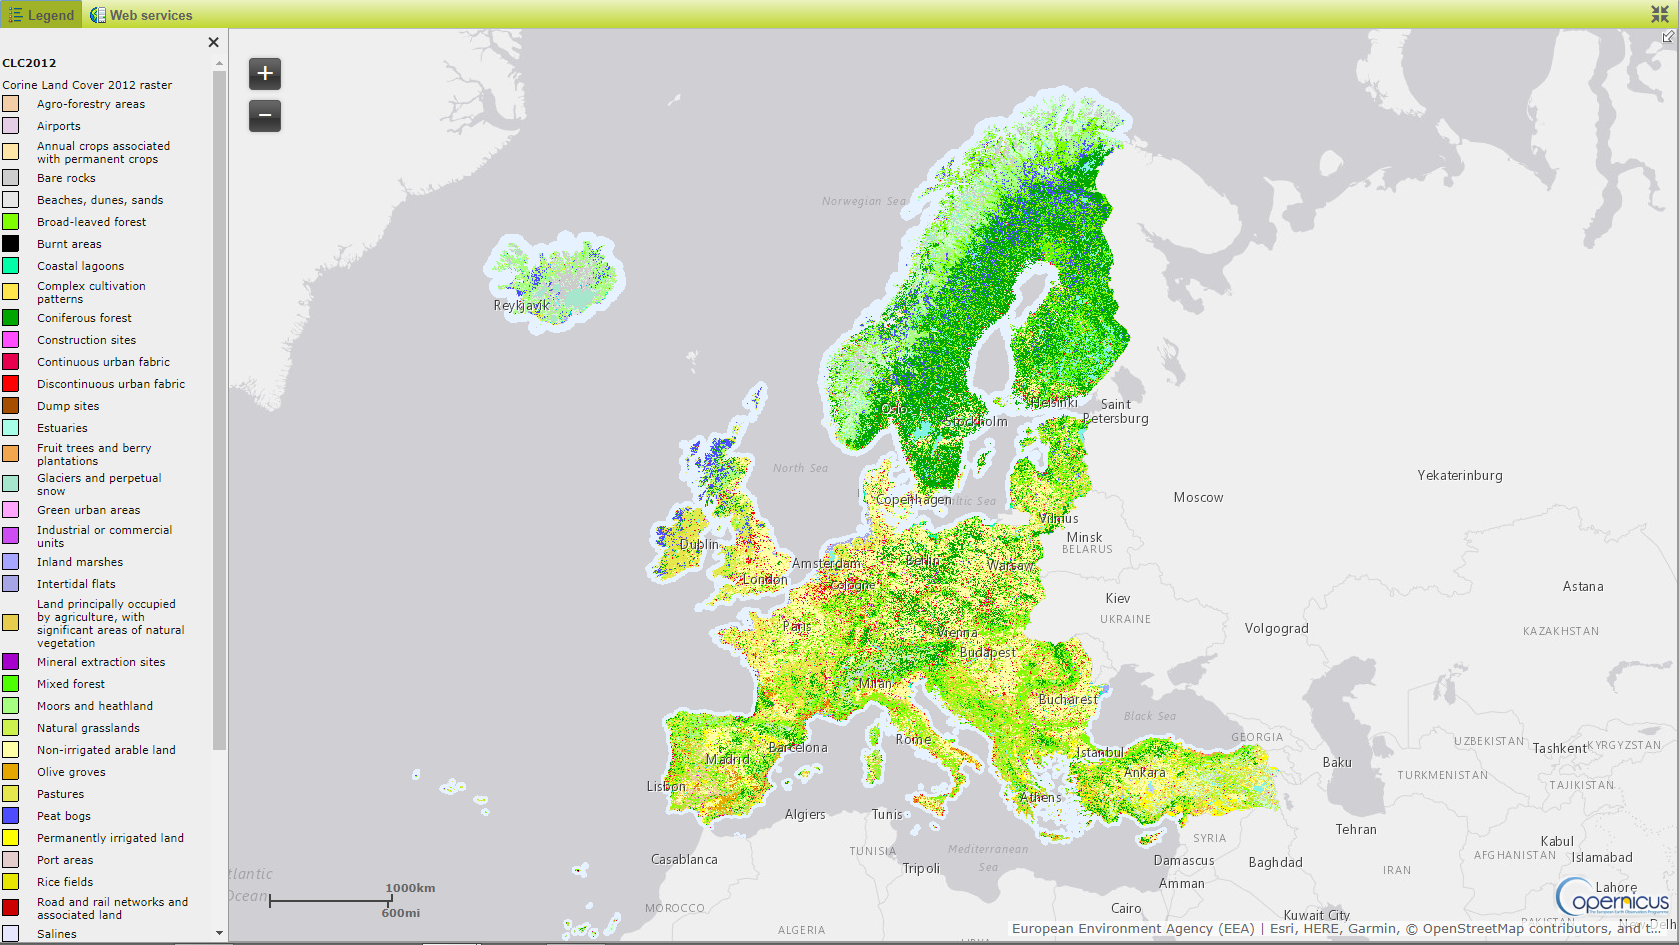
The CORINE Land Cover (CLC) data consists of an inventory of land cover in 44 classes. Its minimum mapping unit is 25 hectares (in the case of polygon features) and 100 m for lineal features. Datasets are available for the years 1990, 2000, 2006 and 2012, covering the European continent (except Belarus, Ukraine and Russia) [...]
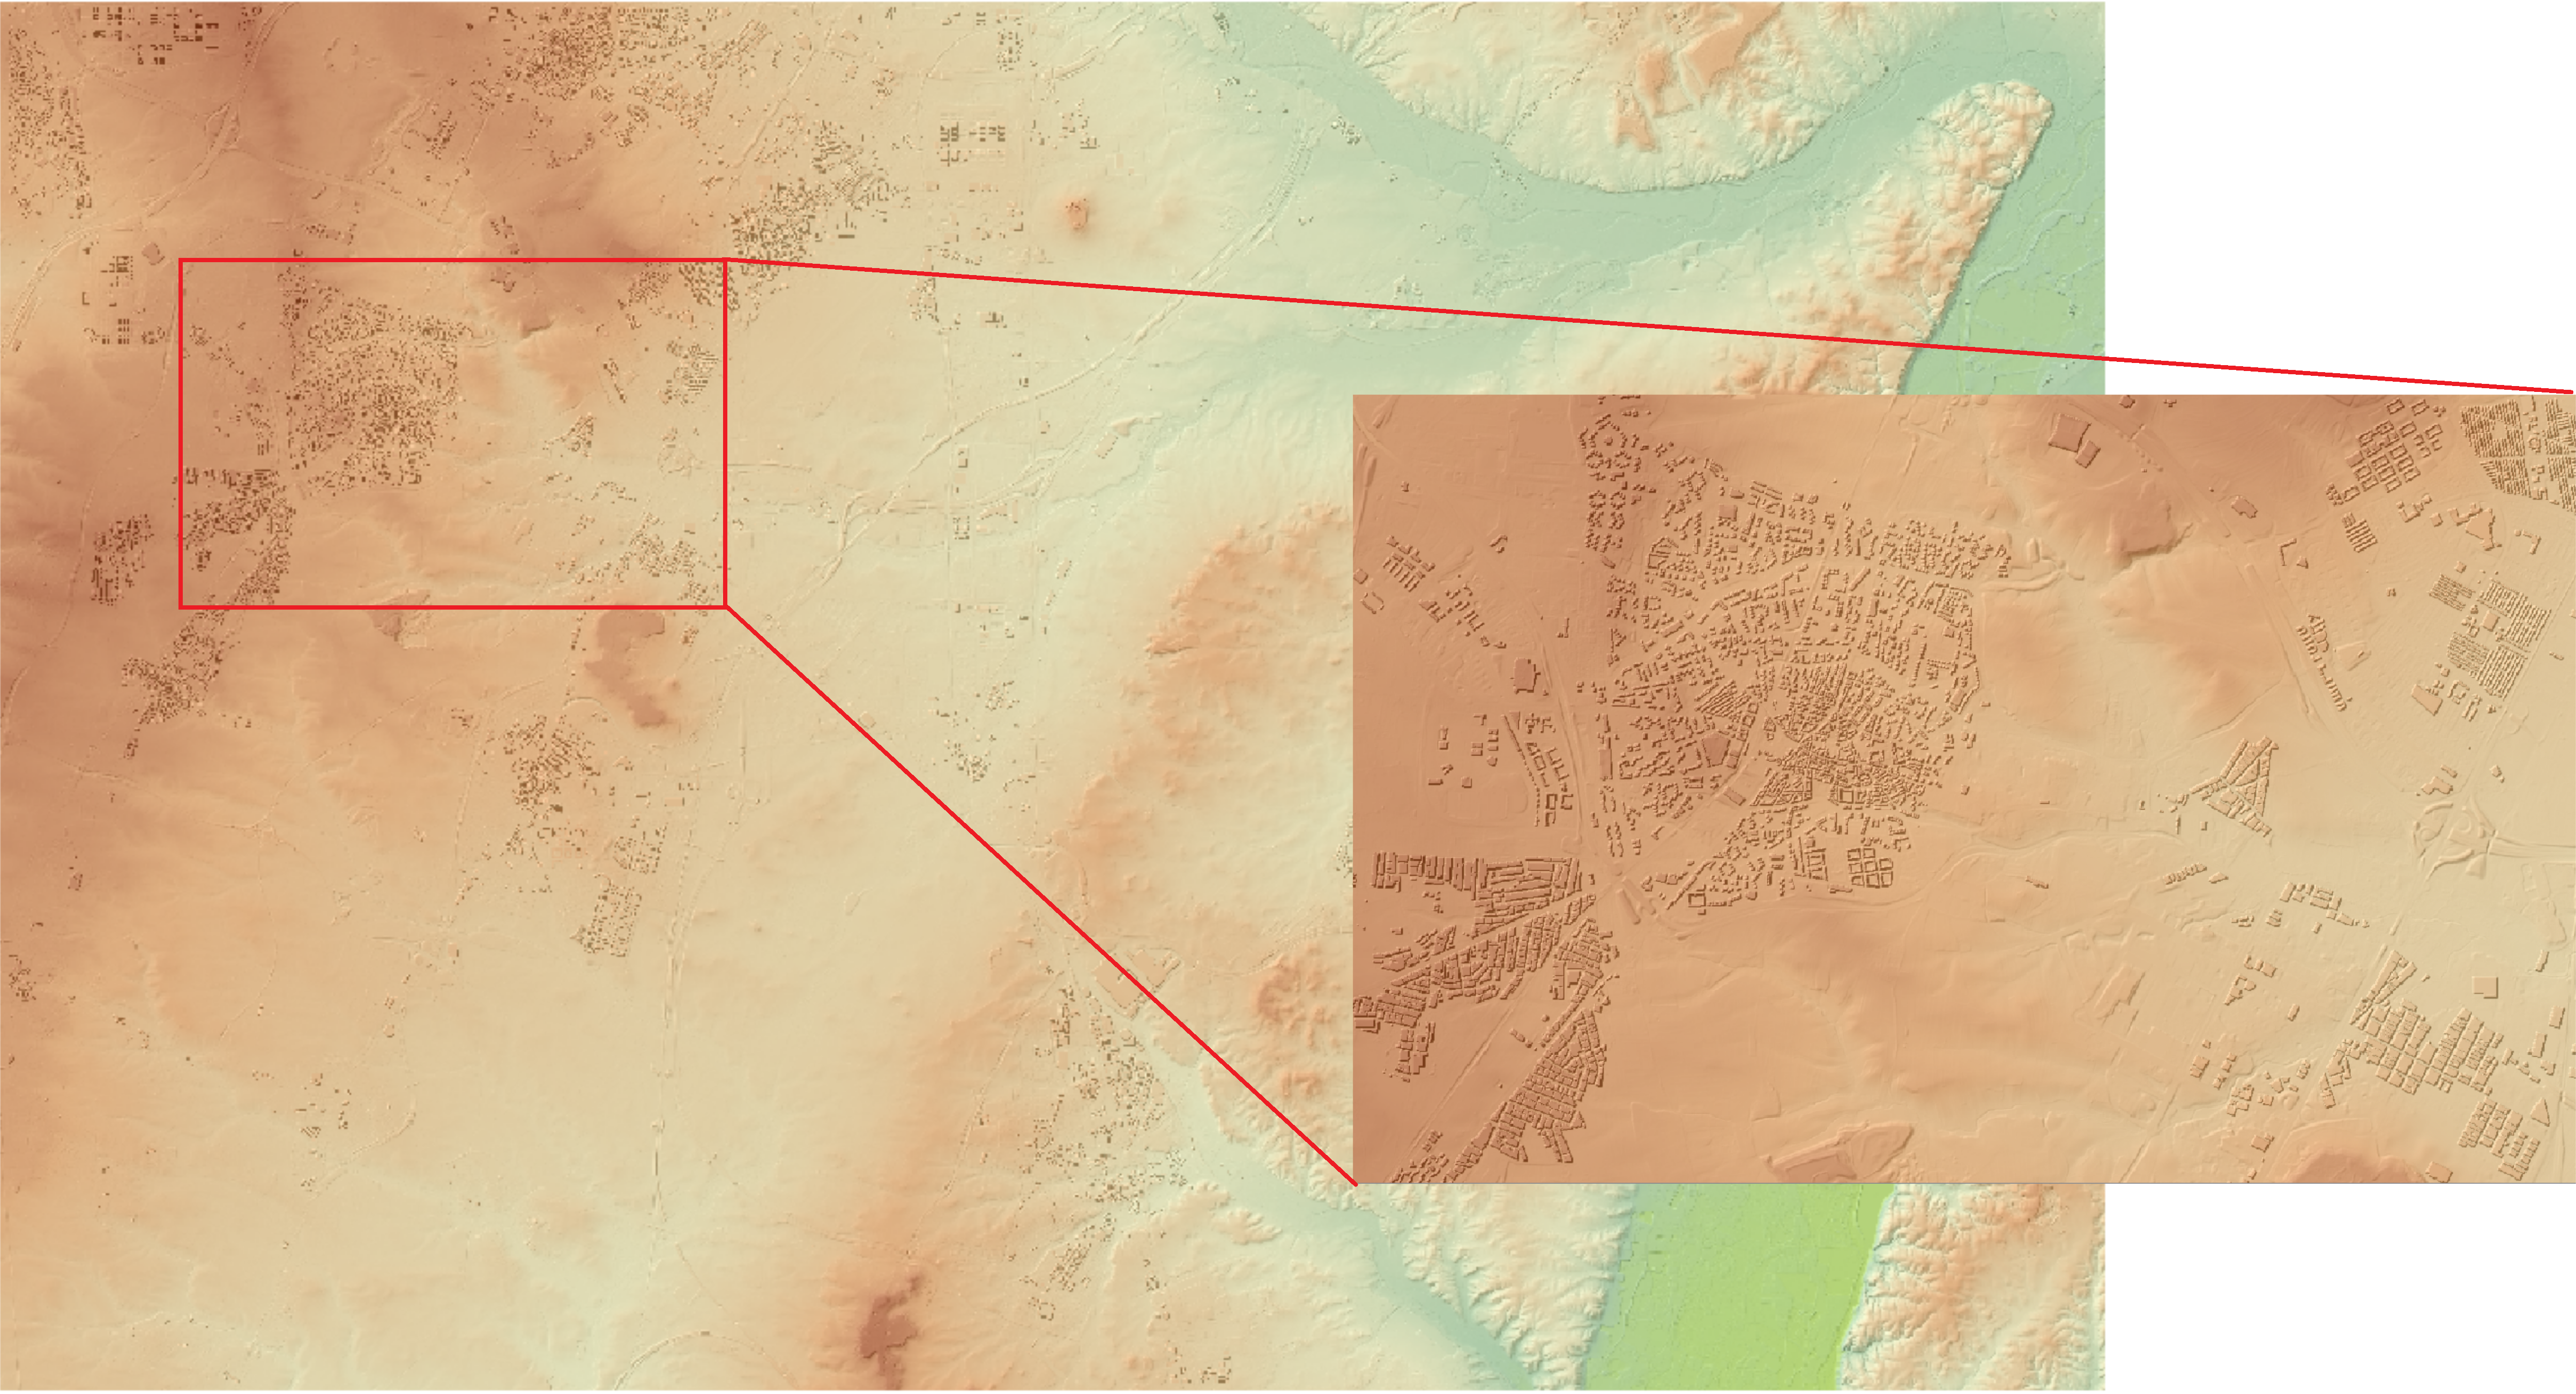
In this exercise we will try to incorporate the height of the build-up areas (average height of 15 m) above the surface of a digital terrain model. In order to do that we will have to follow a few simple steps. Step 1: Load your necessary data into QGIS map canvas Step 2: We will have to [...]
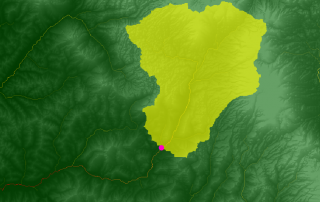
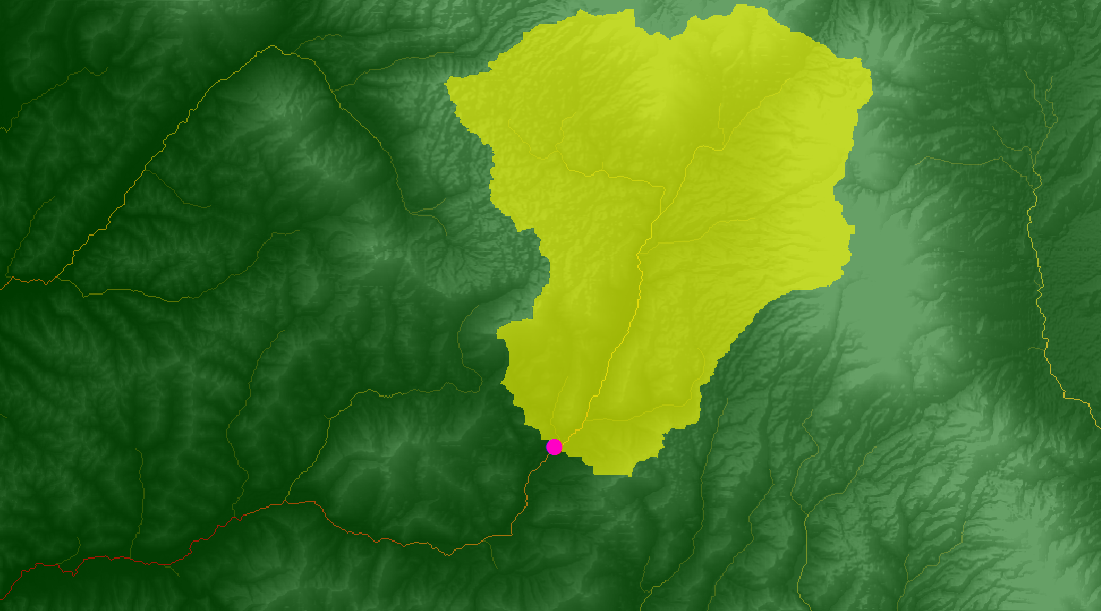
In this exercise we will see how to delineate the boundary of a catchment/contributing area using a Digital Elevation Model and a given point (a specific point for which we want to find the contributing/catchment area). ArcGIS can obtain the total area of flowing into this specific point, also called pour point. In order to [...]