There is a wide variety of tools available for the topographic profile generation in QGIS. Most of these tools are available as plugins. We can highlight qProf, VoGIS-ProfilTool and Profile tool. Finally, QGIS has incorporated this functionality as a tool of its own.
We will focus on this integrated QGIS functionality which can be of great interest in geological, engineering and evironmental studies.
When we try to obtain a topographic profile, we can start from two elements:
• On one side, the layer that contains the height or elevation information. This layer can come in vector (contour lines, lidar point clouds, etc.) or raster (DEM) data type.
• On the other side, the cutting limit line along which we obtain the profile. This cutting line can be virtual and be drawn on a canvas, or belong to an existing layer already loaded into our layer panel.
This time, we’ll describe how a topographic profile obtained from a DEM can be represented.
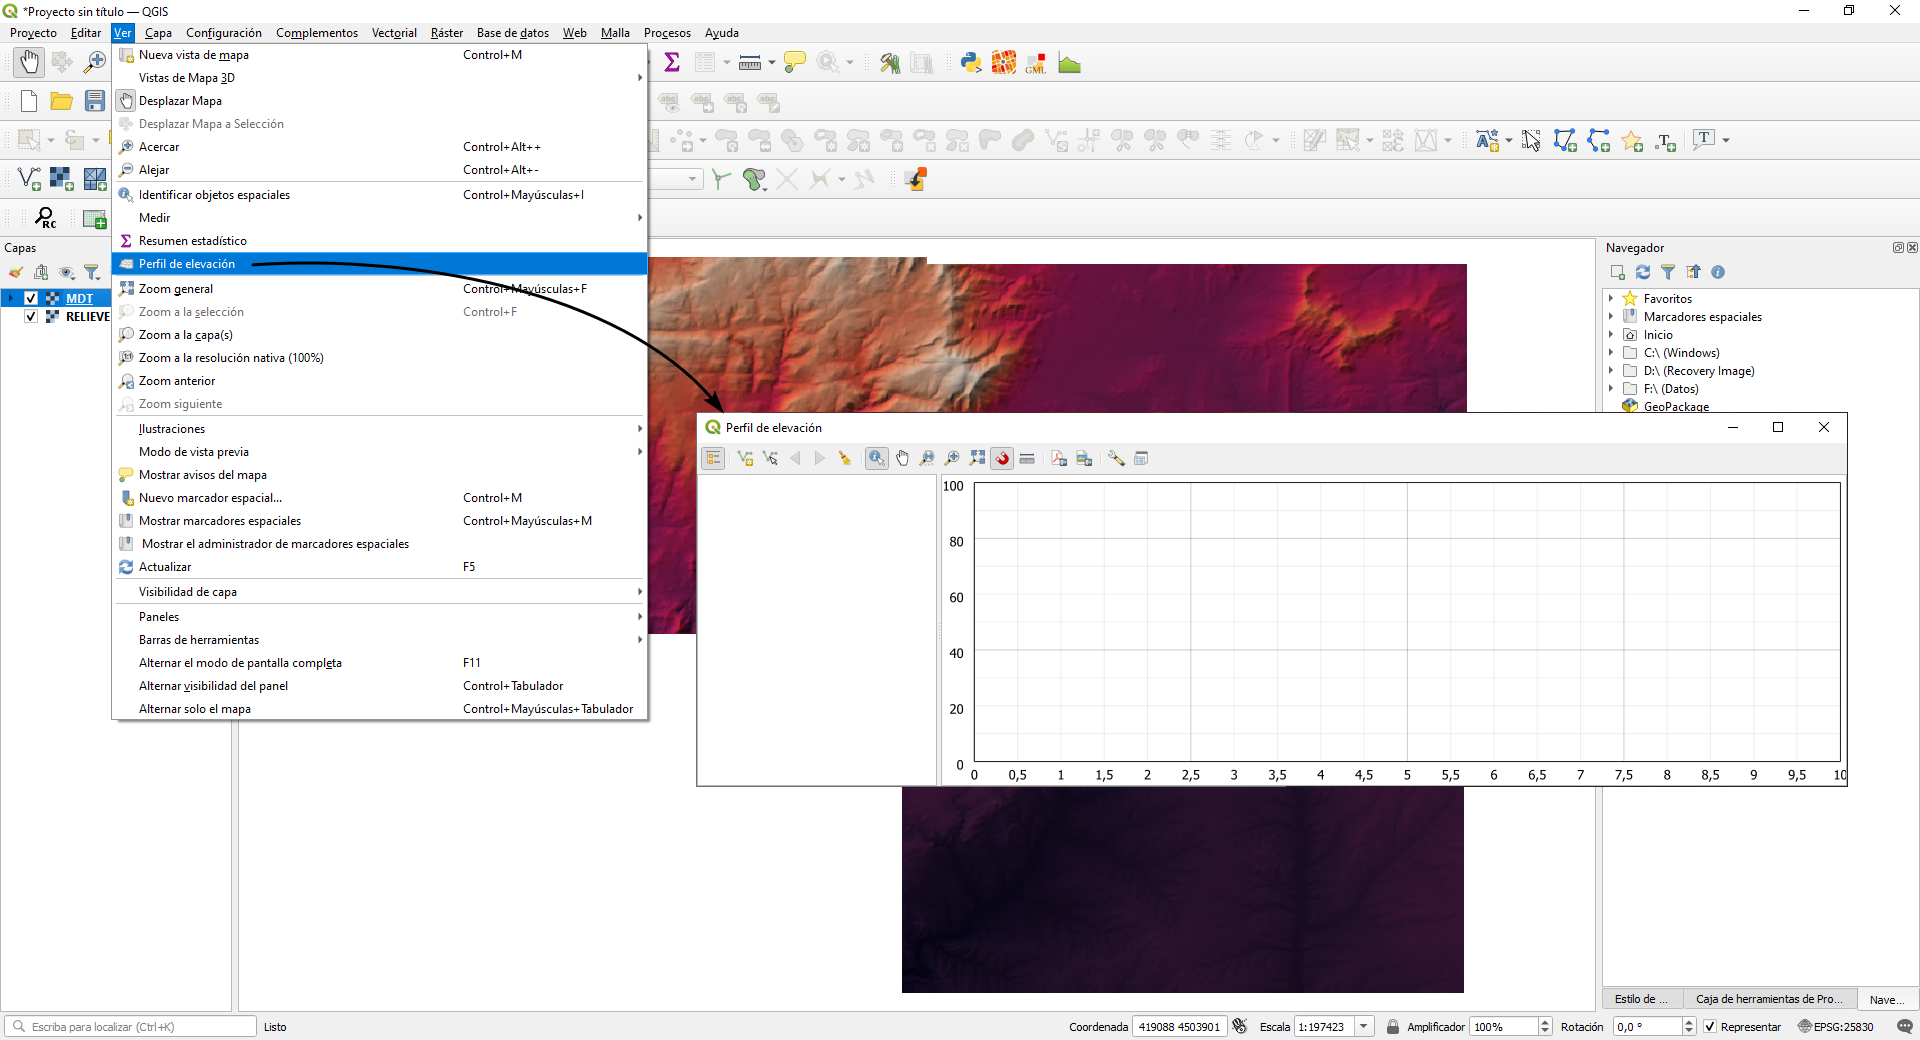
For that, we’ll first enable the tool on the “View” menu and “Elevation profile”. The “Elevation profile” panel will open.
Next step will be to configure the elevation properties of the layer to be represented (DEM). For that, we will double-click on the layer to display the layer properties window, where the “elevation” tab is located.
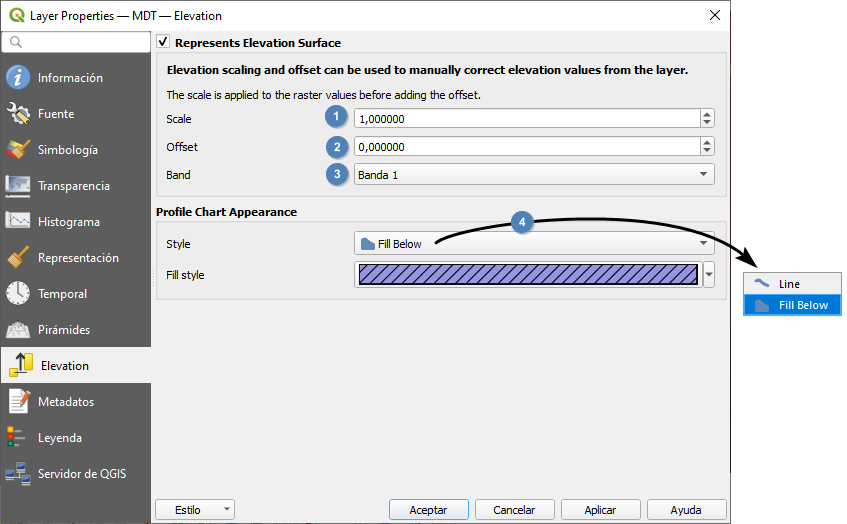
Activate the checkbox for the “Elevation surface representation” (1). This window allows to specify a scale factor (2) in case you want to exaggerate the elevation profile or need to apply a conversion factor of the elevation information and a displacement (3).
On the lower part of the window, we can define how the topographic profile will be represented, through either a line style or a polygon (4).In both cases we hace a complete control of the symbology.
Once the properties of the elevation layer have been configured, we can go back to the “Elevation profie” panel, where we’ll see our DEM layer loaded. We select the “Capture curve” tool (5) and draw a virtual cut line on the DEM. We rigth-click to finish the digitisation of the cut line.
Finally, we get the representation of the topographic profile. By moving the cursor along the profile (6) we can see the elevation and displacement information represented on cartesian axes, and in the canvas on the profile line it shows us the position of the cursor (7) in order to be able to identify its location on the map.
–

 (2 votes, average: 1.00 de 5)
![]() Loading...
Loading...
Original post:
Generación de perfil topográfico integrado en QGIS.
Training provided by professionals


Leave A Comment