Sometimes, we need to generate a grid or network of rectangular cells to place certain elements at specific distances from each other. An example of this could be the systematic location of sampling plots which will be visited for data capture.
To carry out this task in ArcGIS Pro, we have the “Create grid” tool from the “Data management tools – Sampling” set. This tool allows us to generate such rectangular or quadrangular cell networks using polyline or polygon geometries, as well as (optional) point geometries indicating cell centres. Besides that, this grid can be oriented in any direction we want.
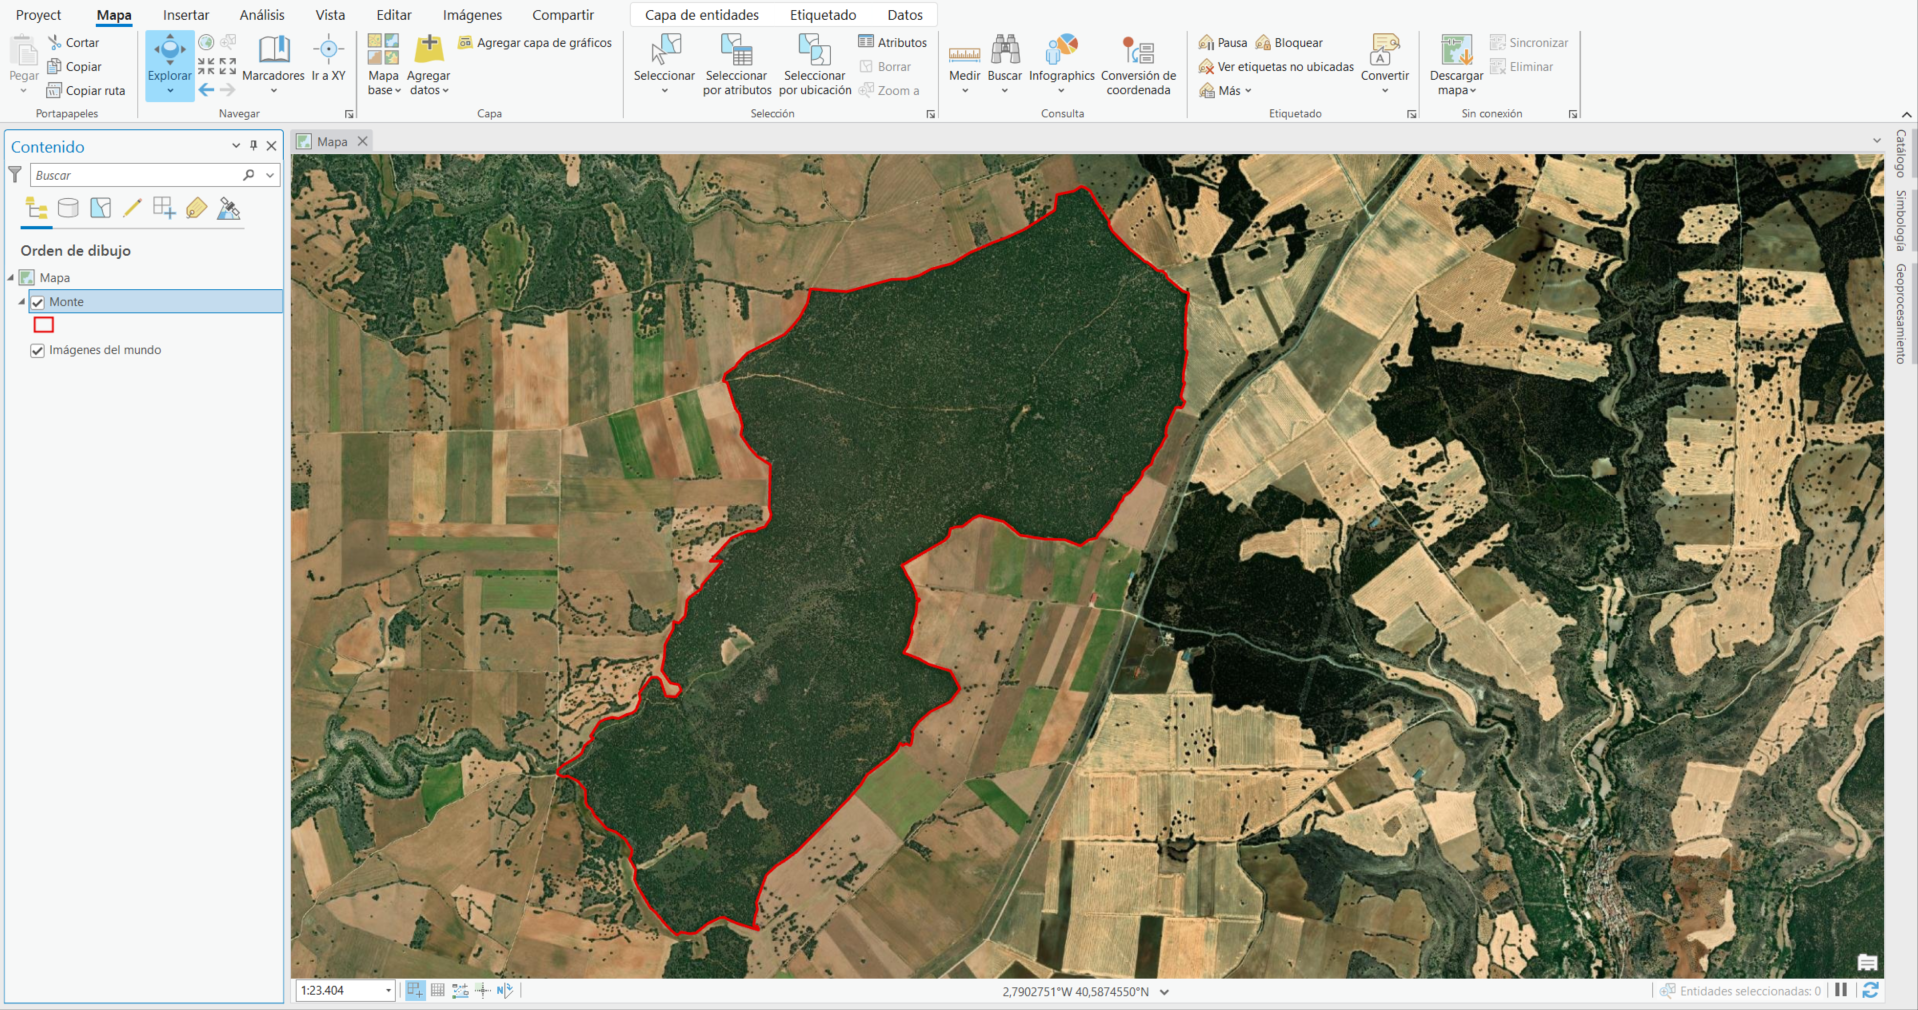
We’ll start creating a grid of vertically oriented quadrangular cells. For that, all we need as imput data is a layer (entity class or shapefile) containing the surface area where we want to generate the grid. In this case, this will be a polygon layer with a single entity containing the surface area of a hill for which we want to generate a network of samplig plots.
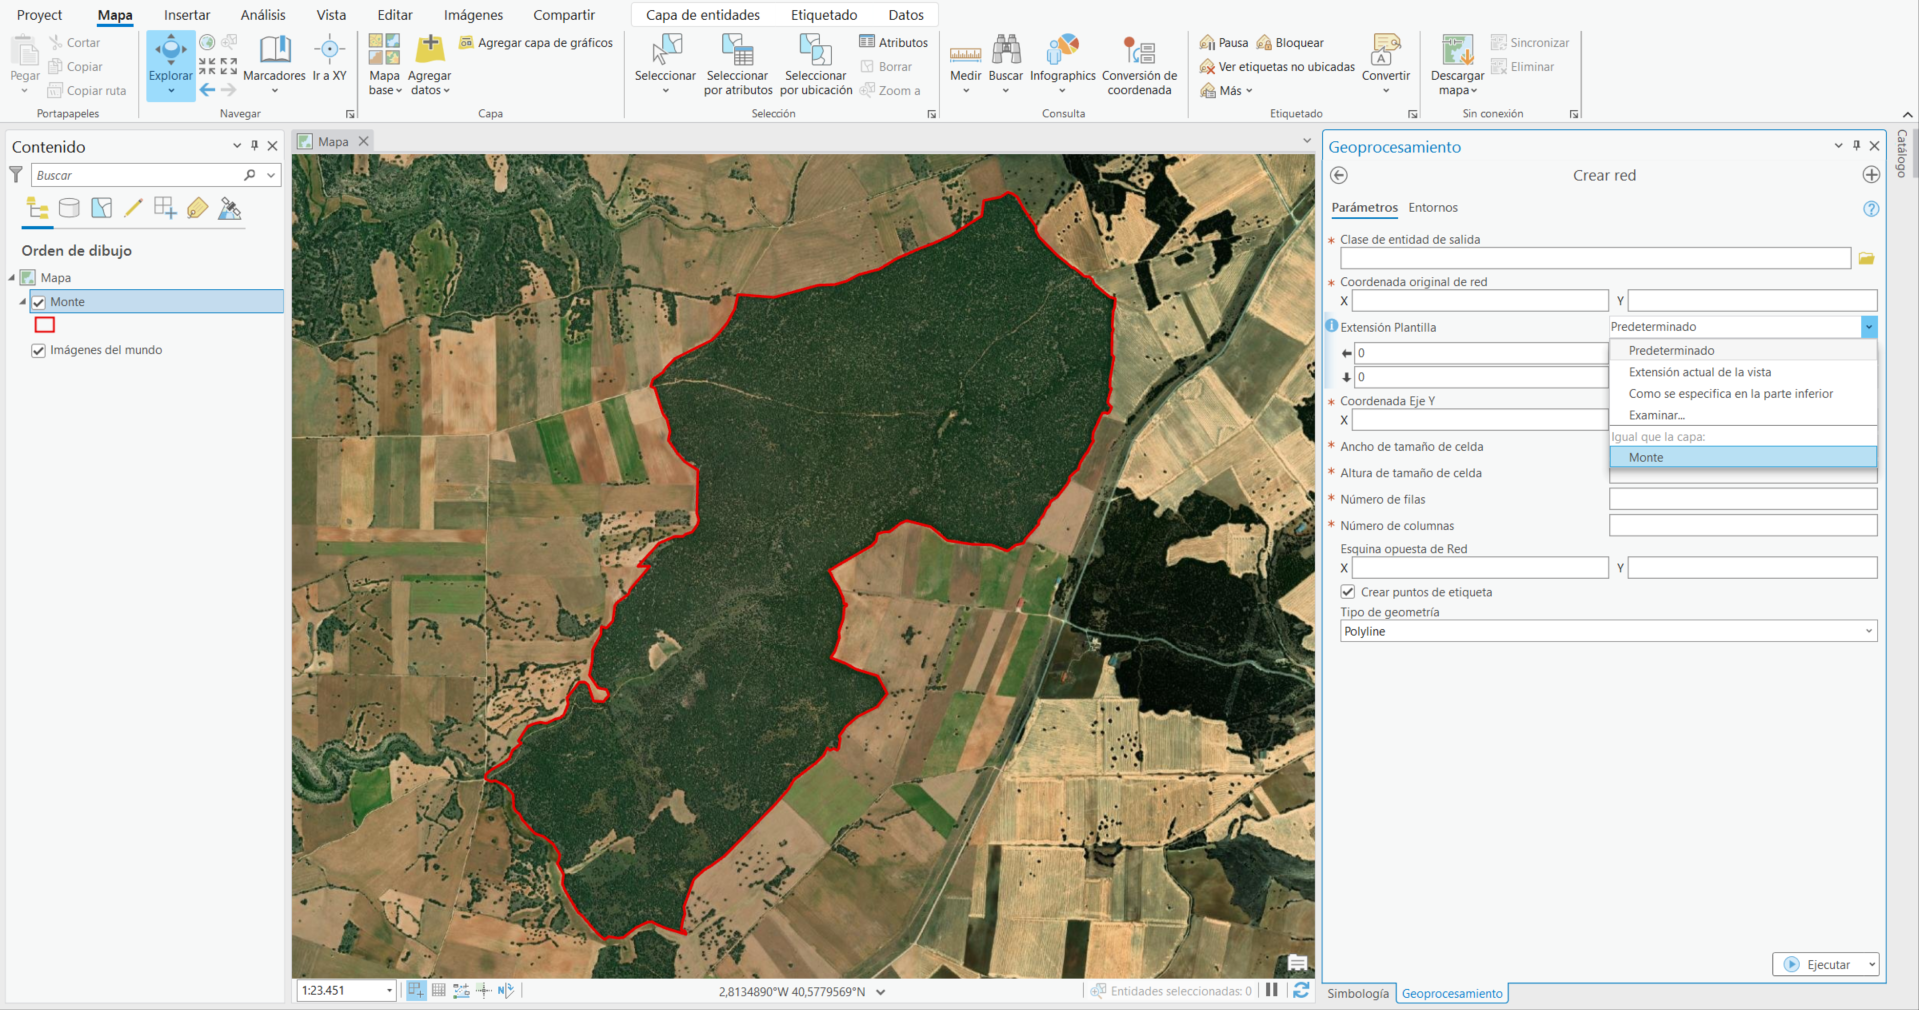
Once the layer is incorporated to our map, we run the “Create grid” tool. First, we must specify the extension of it. For this, the “Template extension” drop-down menu offer us this options:
– Default: the extension will be the maximun size that can be determined by the rest of the entered data (the data extension itself shall remian fixed at 0).
– Current view extent.
– As specified below: Minimum and maximum X and Y values must be introduced.
– Browse…: A layer stored in the system must be chosen. Its extension will be the one used by the grid.
– Same as layer: One of the opened layers in the map will be selected. Its extension will be used for the grid.
In this case, we’ll select: “Same as layer: Monte (Hill)”.
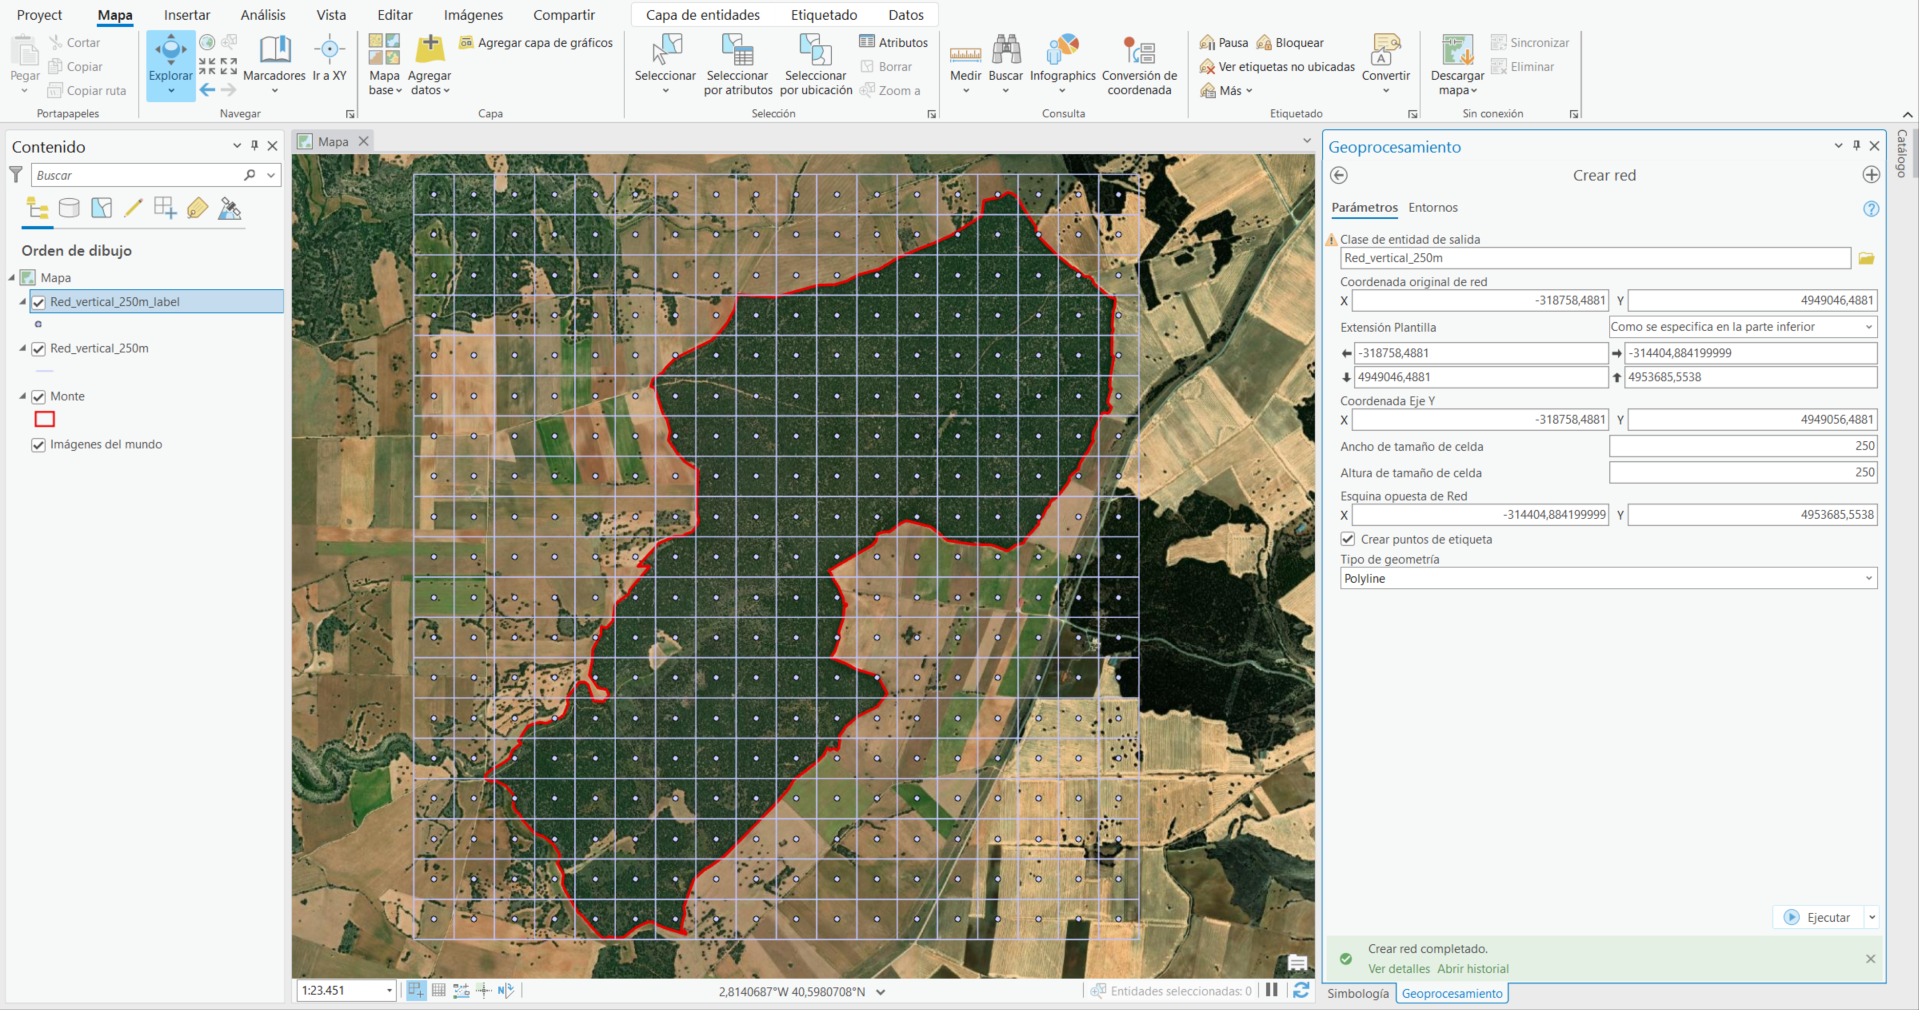
This way the grid will have, as minimum (we’ll see why minimum), the extension of the layer for which we want to generate. We see that upon selection, the checkboxes “Original coordinates of the grid”, “Y axis coordinates” and “Opposite corner of the grid” have been completed, in addition to the boxes corresponding to the extension of the template.
The original coordinate of the grid is the point from which the grid is generated, which corresponds to the bottom left corner of it. The opposite corner of the grid correspond with the upper righ corner and the Y coordinate refers to, aligned with the orignal coordinate of the grid, gives place to the line that determine the direction of it. By default, a Y point located 10 metres north fromt he original coordinate is generated, which gives place to a vertical grid. If the original coordinates or the ones in the opposite corner are modified, the final extension of the grid will adjust.
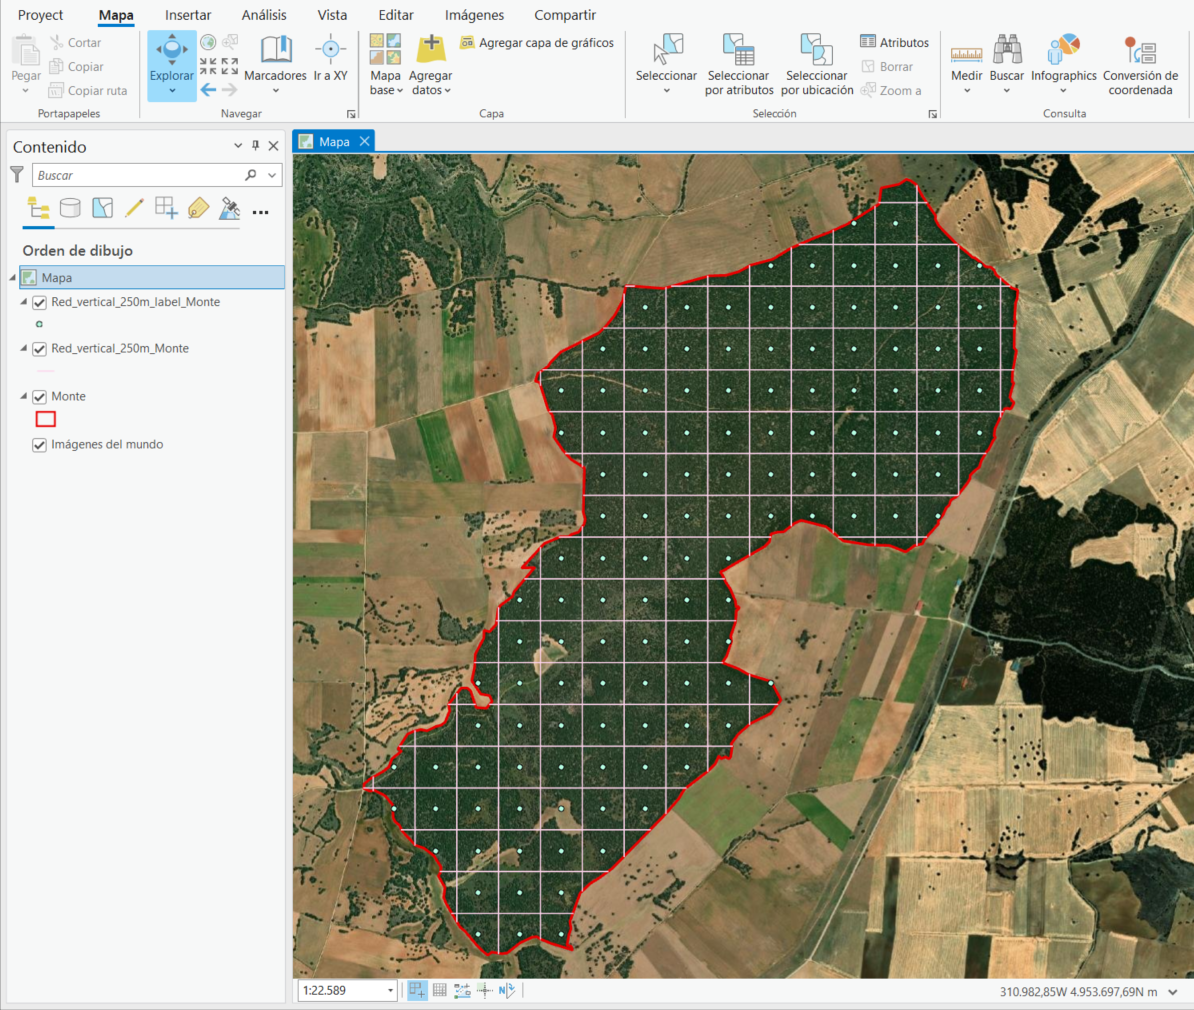
Hereafter, we must choose either the size (height and width) of the cells or the number of columns and rows that must be build inside the previously indicated extension. In this case, we have introduced the same distance for both height and width of the cells (250 metres), which will result in quadrangular cells.
Finally, we must choose what type of geometry we want the grid to be generated in (Polyline or polygon), as well as pointing out if we want an additional point layer containing the center of every cell (“Create label points” checkbox). In this case, we check this box because said points will be the center of our sampling plots.
The only thing left to do is to define the name and location where it will be saved and run the tool. The result will consist on two layers (one the grid itself and the other one the centers of each cell) on which the grid will have a vertical orientation and its extension will only match with the previously established if none of the columns or rows is left incomplete, in which case it will be completed beyond the pre-established extension.
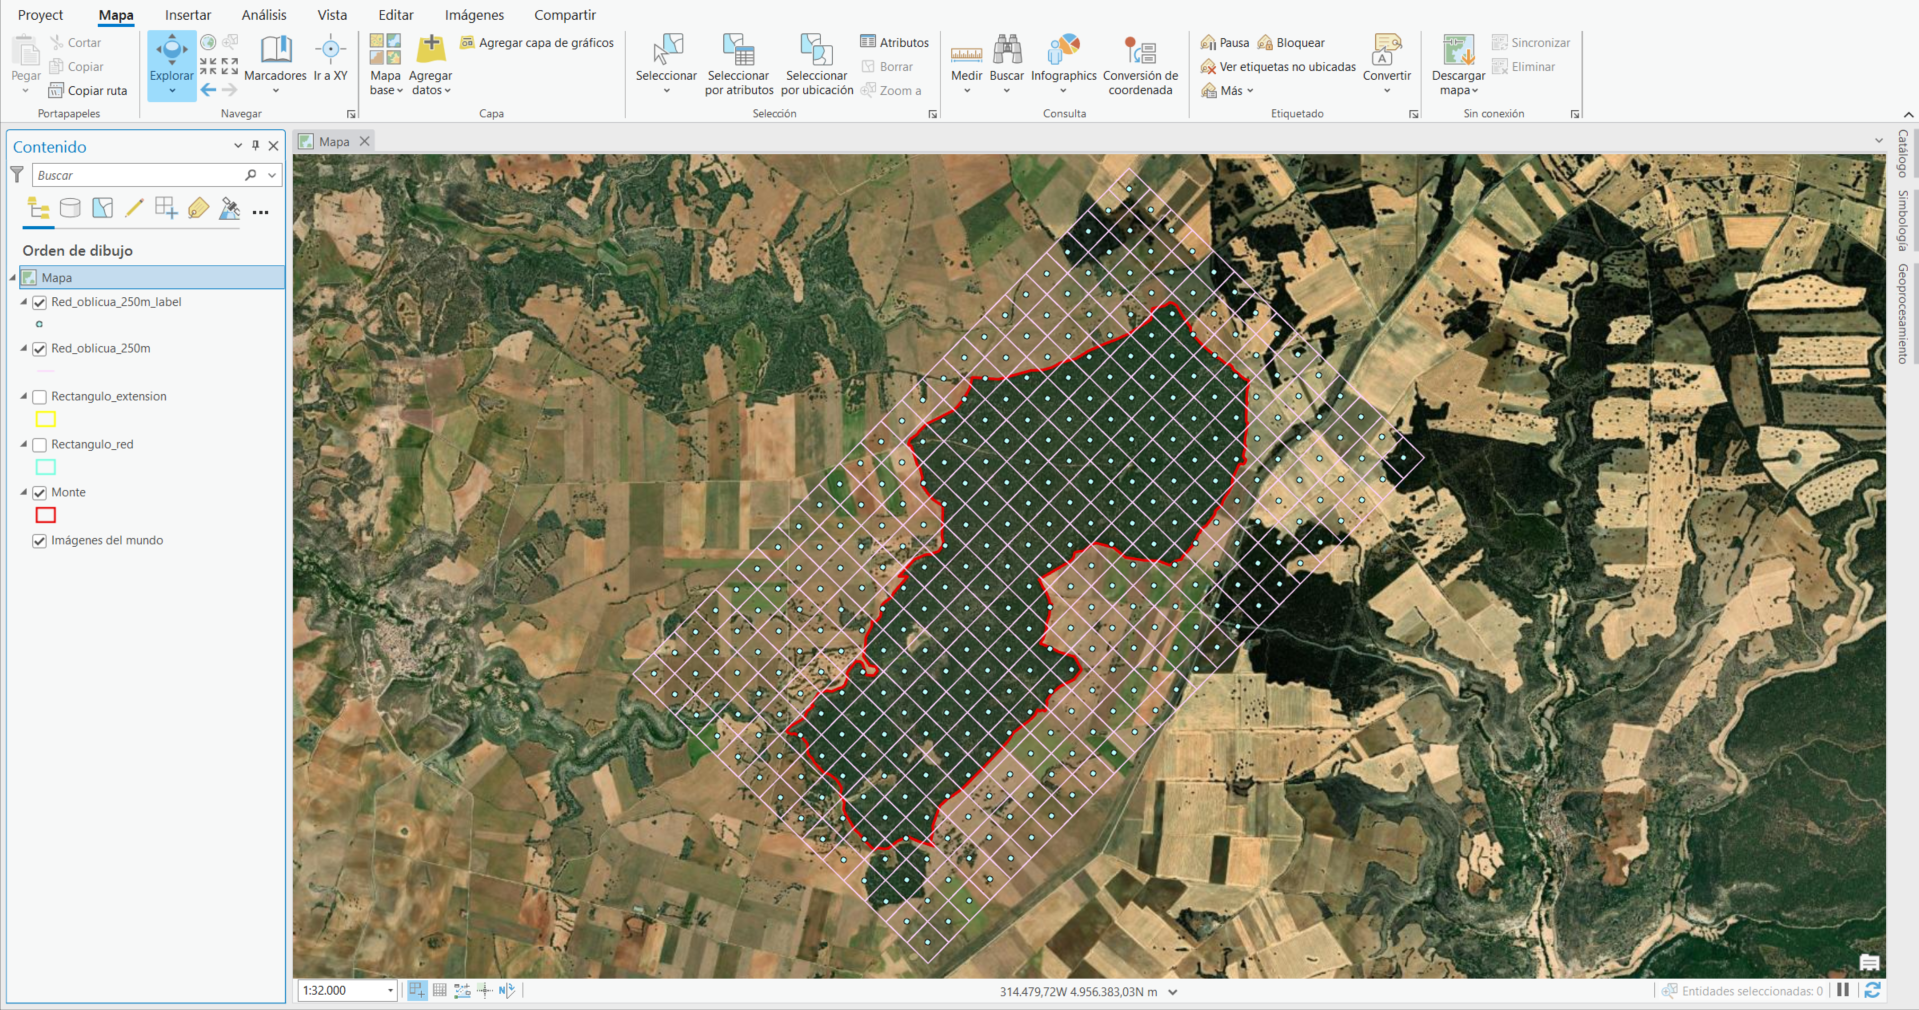
To generate a grid with a different orientation, we must modify the “Y axis coordinate” parameter so that , together with the point of origin, the line whose direction the grid will follow is defined. We must consider that on this case, the extension will no longer reference the surface area on which the grid will be generated, but rather continue referencing the rectangular/quarangular area that would occupy in case this was vertical. Therefore, we must think of a strategy to define both the extension and the direction of the grid so it falls over the desired surface area and orientation.
In our case, two polygon layers have been generated. On the first one a vertical rectangle has been created with a extension big enought to cover the hole target surface area (Hill) and whose lower left corner matches with the desired point of origin of the grid. On the second layer, a rectangle was also created, with its lower left corner also matching the point of origin of the future new grid, but it is oriented on the direction we want to build the grid.
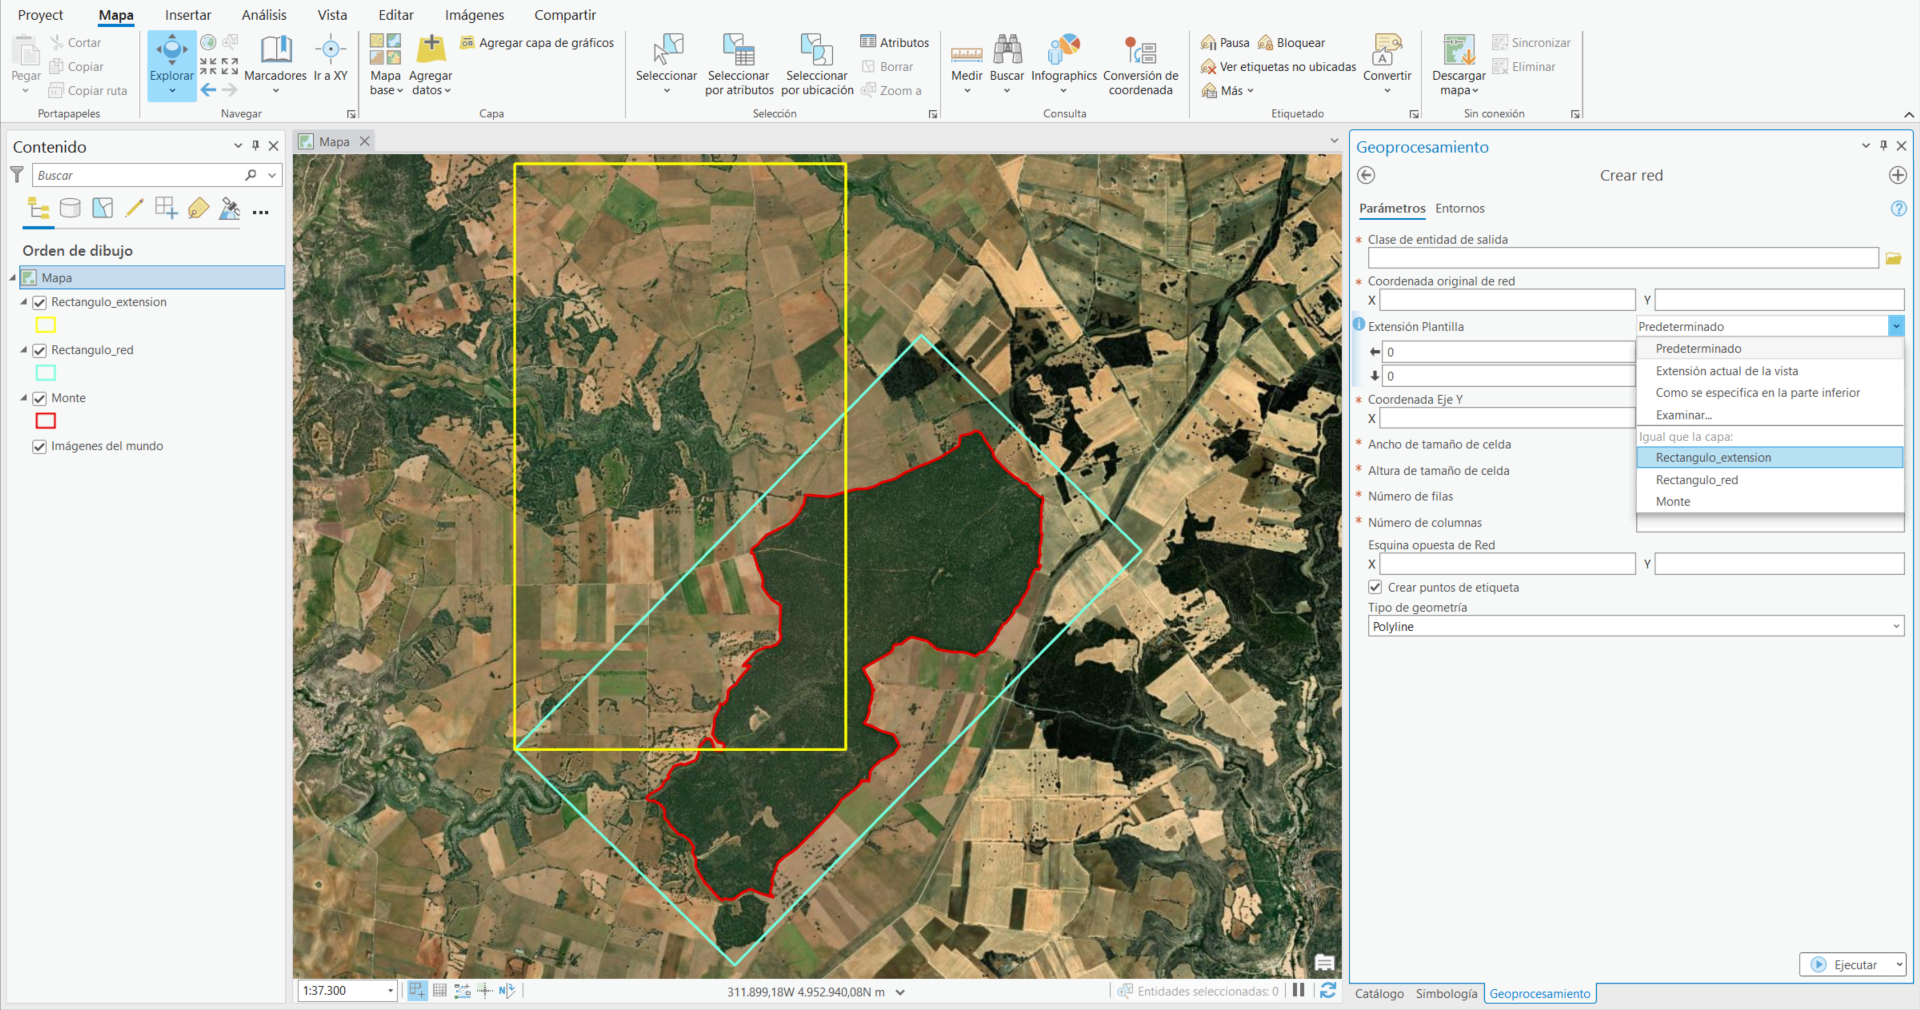
The layer that contains the vertical rectangle will be used to define the extension of the grid, while the other one will be used to define the Y axis coordinate by extracting the coordinate of the upper left corner of it. After defining the rest of parameters, we run the tool and we’ll have our new grid cell, oriented in the desired direction and covering all the target surface area.
It is worth mentioning that although our diagonal rectangle covers the hole target surface area, it’s not necessary. In fact, a line could be used or even we can introduce manually the coordinates of the point we want.
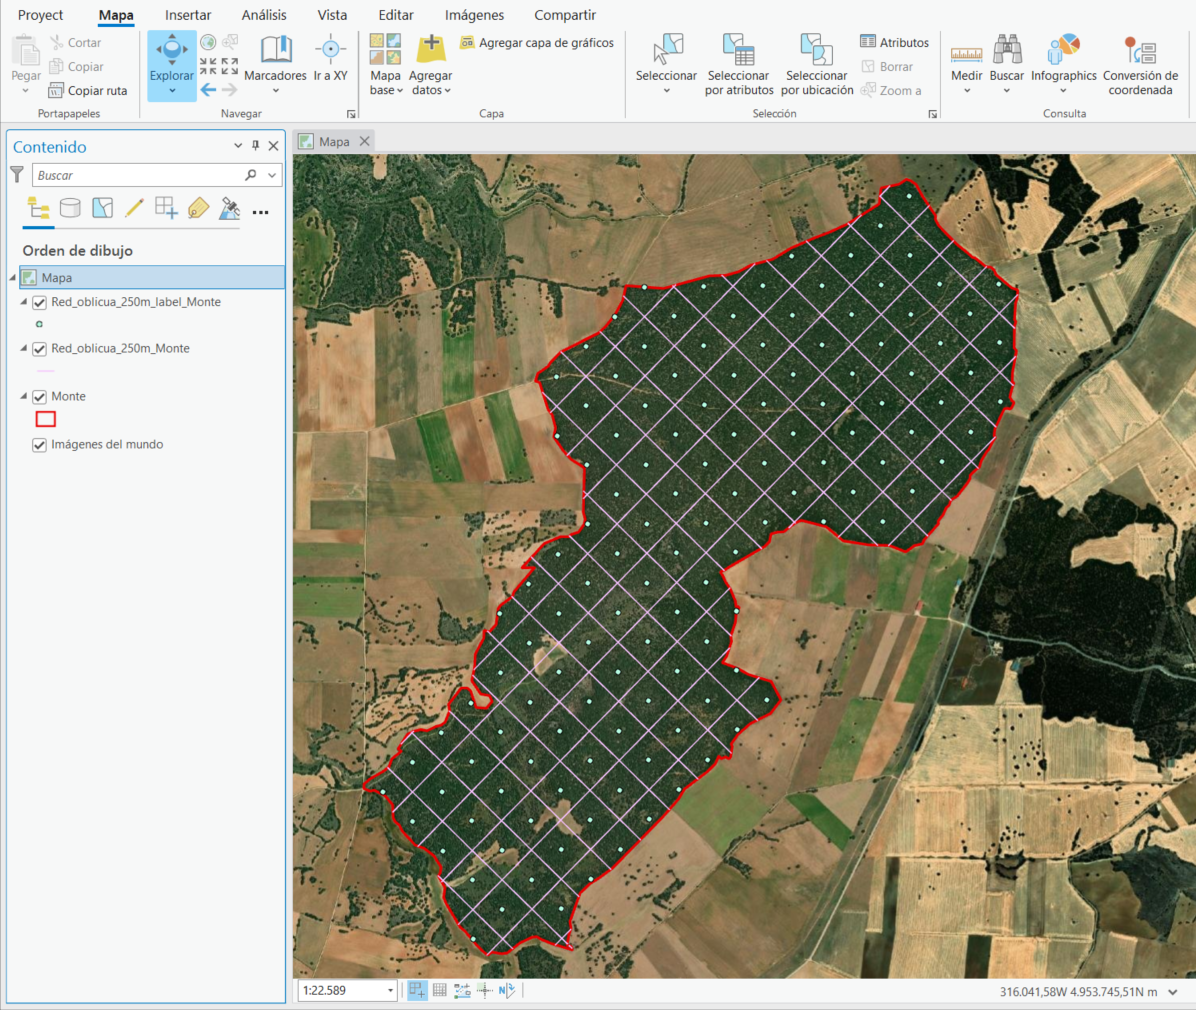
As an additional step, we might want to restrict the grid to only the target surface area, which does not need to be rectangular or quadrangular. For that, we use the “Cut” tool (Analysis tools – Extract) selecting the grid layer as “Input dataset or entity” and the target surface area layer as “Cutting entities”.
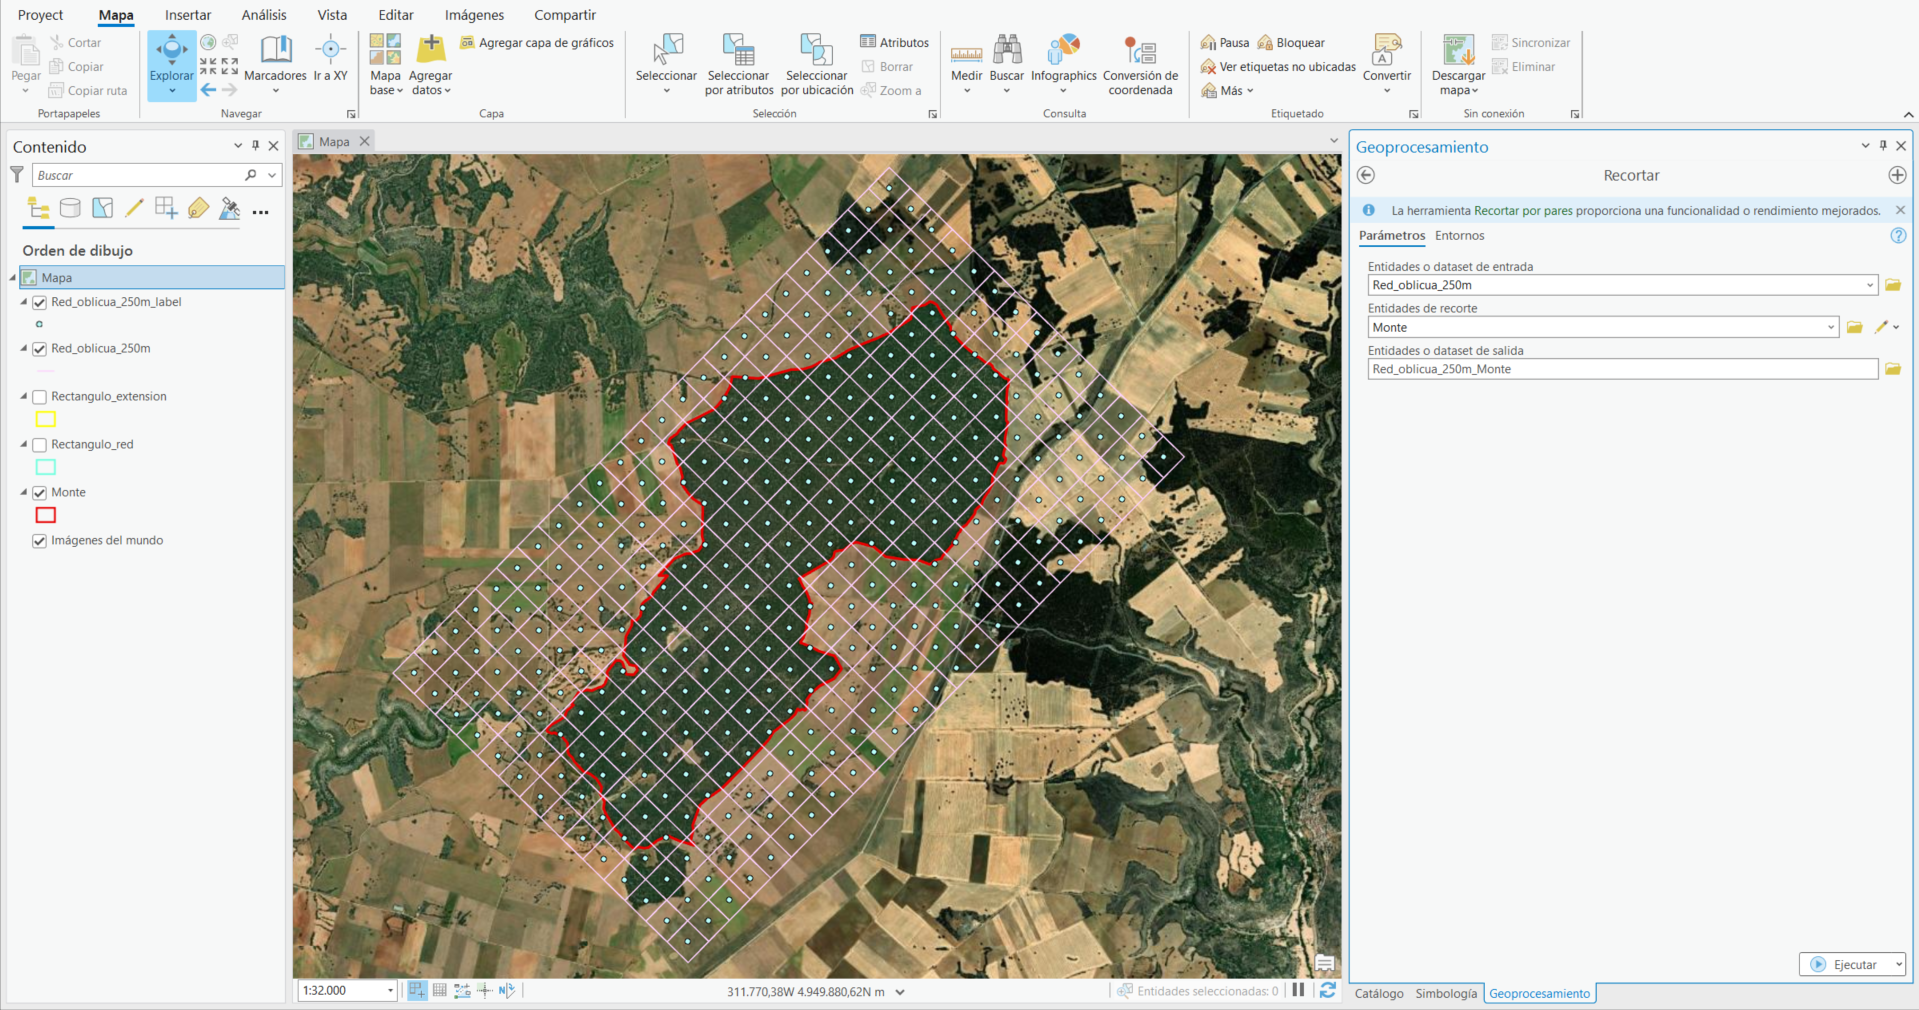
After running the tool, we will now have our cell grid confined to our target surface area.

 (2 votes, average: 1.00 de 5)
![]() Loading...
Loading...
Original post:
Crear una red regular de celdas en ArcGIS Pro.
Training provided by professionals


Leave A Comment