This QGIS add-on is used to work with statistical data, generating reports by groups or categories for an attribute table field. Here below we’ll see how to use it.
In this case, we’ll work with roads, towns and municipalities data from the Chiapas state, Mexico.
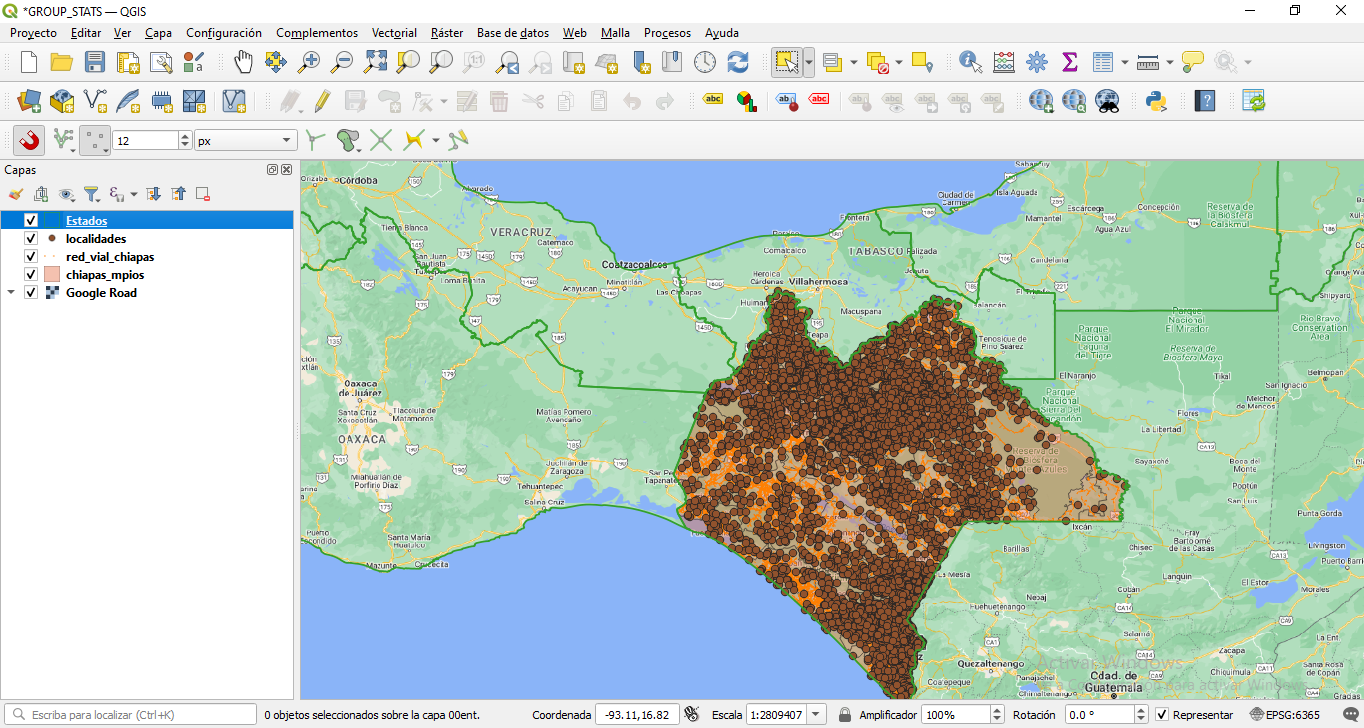
First thing, we upload our data into QGIS.
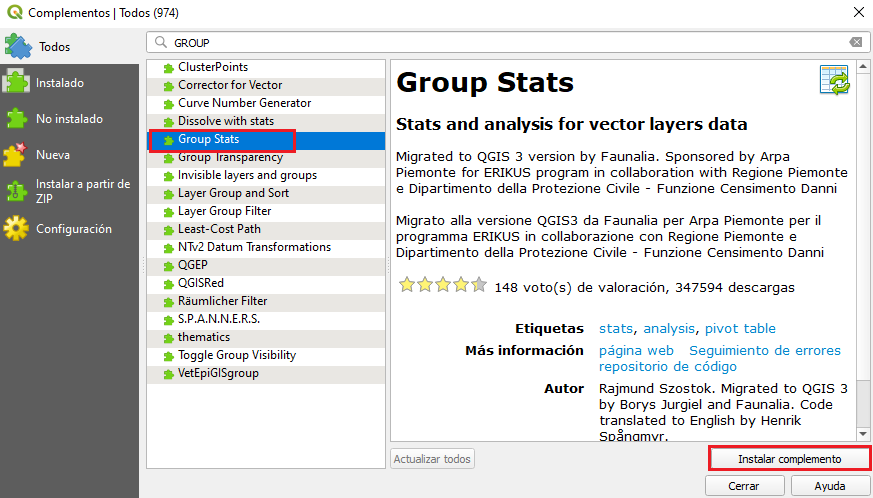
In order to start working with the plugin, we must install it from the QGIS add-on section.
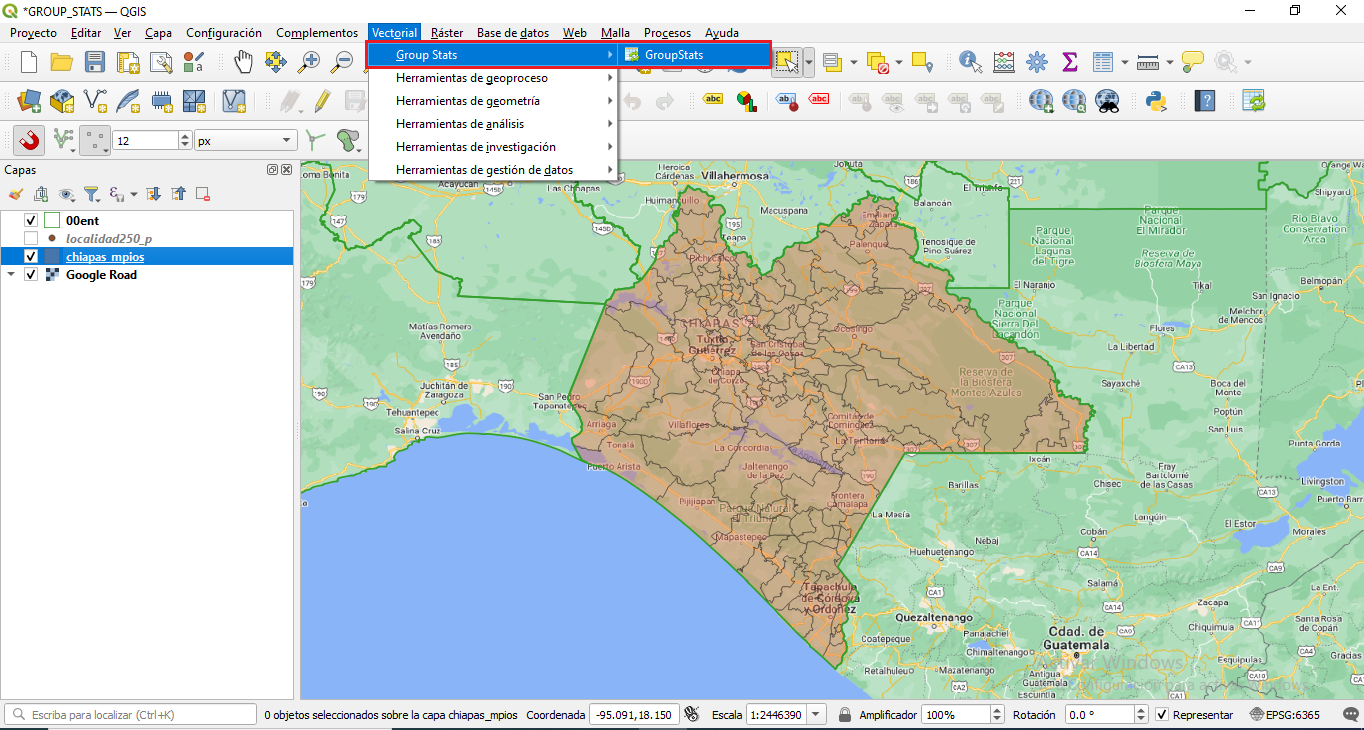
Once installed, we can start working with our data. We can access the add-on as follows:
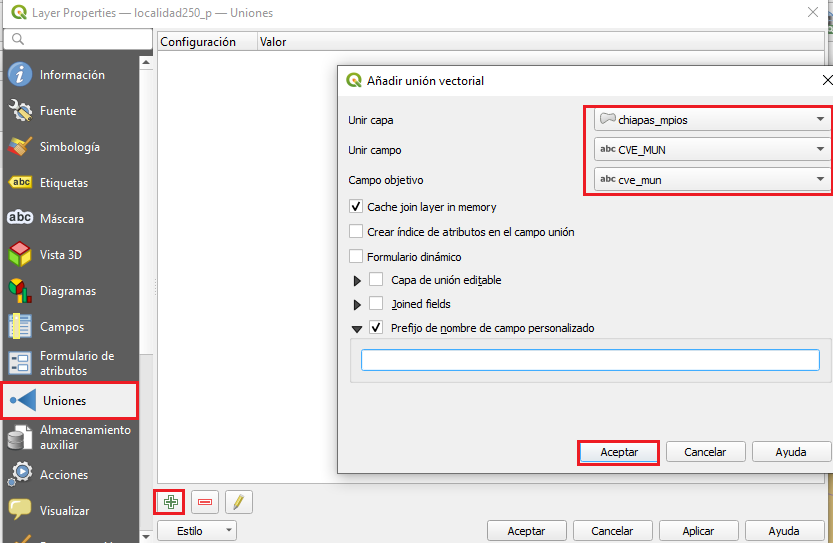
Next step will be to broaden the attribute table with more information. For exmple, in the “Town” layer we will add a field with the municipality name. This will be done with the Join tool located in the layer properties. Let’s remember that this Join is made only virtually, so the layer must be exported if we want to keep this joined data permanently.
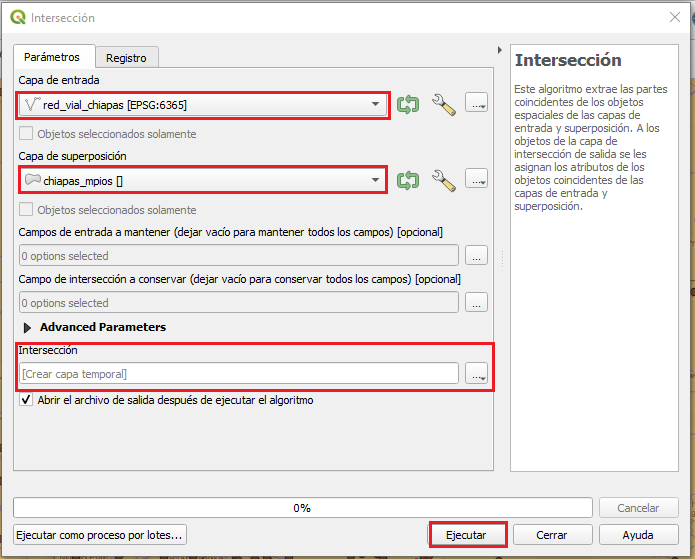
Following up, we will combine the Roads and Municipalities layer to define an administrative boundary. This is in order to obtain an estimate of the lengh of a road type within each municipality.
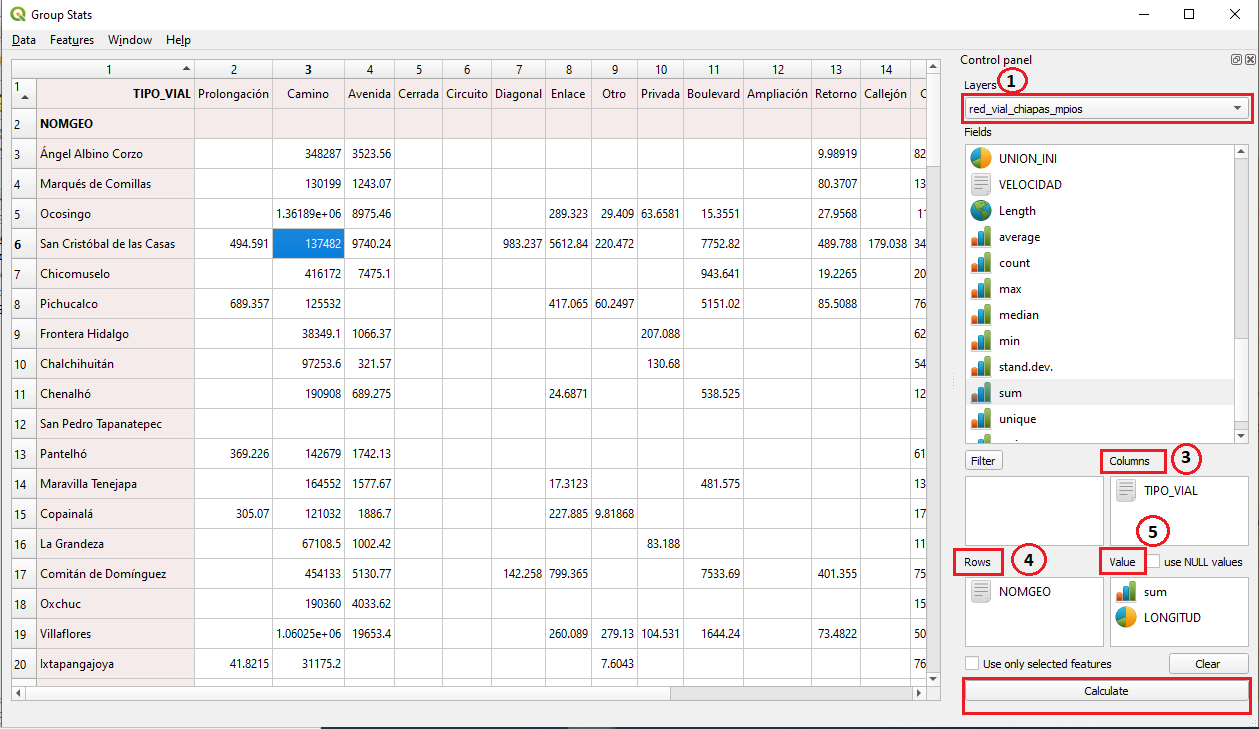
Once all fo this is done, we can continue with the “Group stats” plugin. Using this tool, we’ll calculate the sum of the lengh for each road type in each of the municipalities.
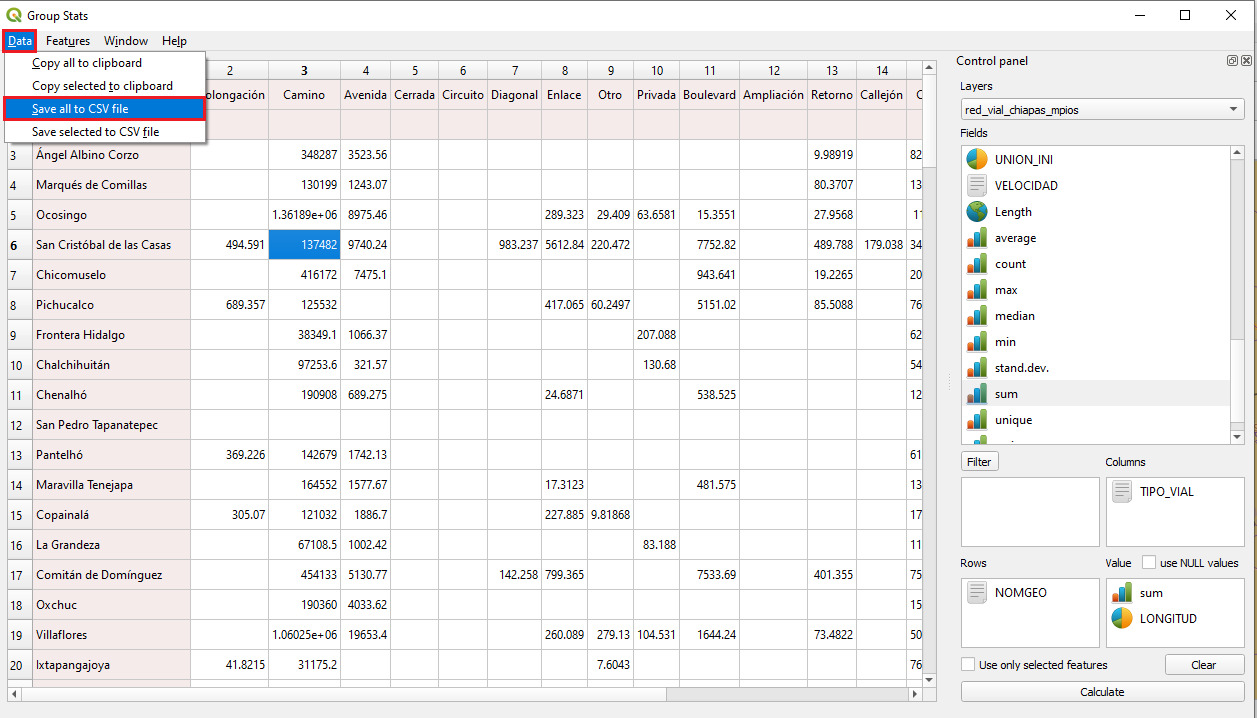
First, we must select the vector layer to calculate the statistics (1).After that, we drag the attribute fields to locate them in the columns (2) and rows (3) section. In the Value section, keep in mind to drag a numeric value that needs to be analysed and next to it the statistic we want to calculate with those values (4). It is important to mention that only one statistic can be chosen. Then, the calculation can be made and it can be displayed in a table which is usually a two-entry table.
Once the results have been obtained, they can be exported in CSV format so they can be consulted later if necessary.


 (3 votes, average: 2.33 de 5)
![]() Loading...
Loading...
Original post:
El plugin «Group Stats» de QGIS.
Training provided by professionals


Leave A Comment