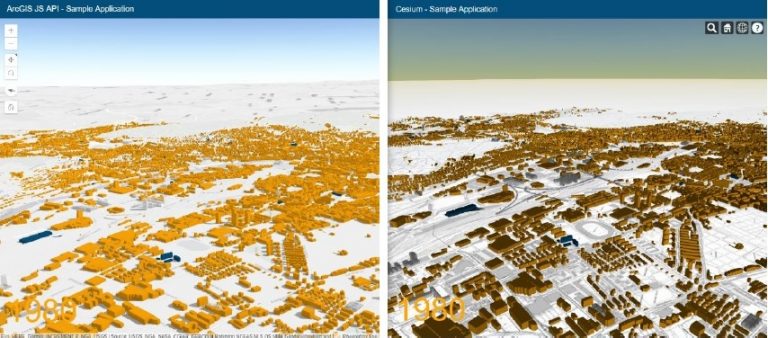
In this exercise we will try to compare two of the best 3D Web Mapping APIs that currently exist on the market. We will focus on the main differences when it comes to data modeling, processing, symbolization and visualization.
On the one hand, The JavaScript API is performing better when it comes of visualization and geoprocessing and on the other hand Cesium carry out functions like interaction, geometry and programming with sharpened results.
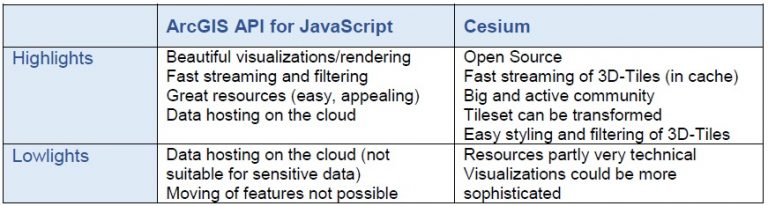
The next chart will get you an idea about the main functionalities of these two APIs and about their performance in each application.

The cartographic viewers need a server in order to deploy. Cesium uses Node.js while JavaScript API behaves well with IIS (Microsoft Internet Information Services).

Both of the applications have developed their own 3D data type formats. One the one hand, the JavaScript API has created the standard ESRI Indexed 3D Scene Layer (i3S), on the other hand, Cesium works with its 3D-Tiles format. Both of them created under OGC standards, i3S being recently approved as an OGC standard.
One of the main difference is the way data is managed when loaded in the web page.
The data used by the JavaScript API must be uploaded in the cloud and then can be accessed by the application, while Cesium usually loads local data from your computer even though it can be loaded from an external cloud. The speed of loading and interaction with the data (in the first case) depends on the internet speed and quality.
There is another fundamental distinction, the zoom levels are different between the two applications.
In Cesium there is no legend widget like in ArcGIS API for JavaScript (which have a dynamic legend widget) so the legend must be created manually.
Regarding Symbolization, Cesium application approach a much more simple one comparing with the one integrated by ArcGIS API for JavaScript which allows a lot of different data visualization options.
The Esri JavaScript API has several strong points, such as hosting data in the cloud, (although this is not recommended for sensitive data), improved visualization design, fast transmission, support and resources. On the other hand, among the positive aspects of Cesium we find that it is open source, supported by a very large and active community and fast transmission of 3D-Tiles.
Data source of information: You can check more about this in the paper Cesium vs. ArcGIS API for JavaScript An assessment of the usability of virtual globe toolkits to create an animated 3D web scene from Institute of Cartography and Geoinformation, ETH Zurich at the link below: http://www.ika.ethz.ch/studium/cartography_lab/2017_staehli_report.pdf
Find out about how to develop cartographic viewers with ESRI products, Carto, Mapbox and Google Maps with our online course Development of Web Based GIS Applications using ESRI products, Carto, Mapbox and Google Maps – Online GIS Training.
Quality training taught by professionals
RECOMMENDED COURSE


Leave A Comment