One of the most common analysis used in every GIS is to represent service areas around any location, using, at first, a Buffer Analysis.
In this example, we have used a ArcGIS Desktop application: ArcMap.
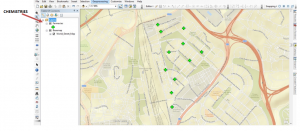
Firstly, we have one layer (point layer, because it has concrete addresses) in ArcMap. It represents, in this example, pharmacies. Given these data, what is the area if influence from all the pharmacies? We use then, the Buffer geoprocessing tool.
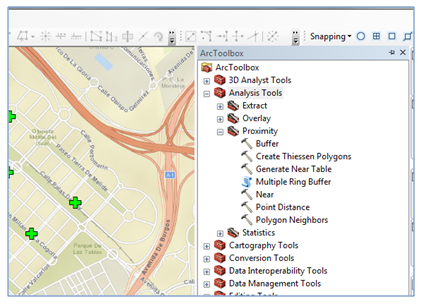
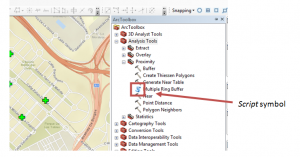
Go to ArcToolbox and open Analysis Tools.
When we open the Buffer tool, it looks like this:
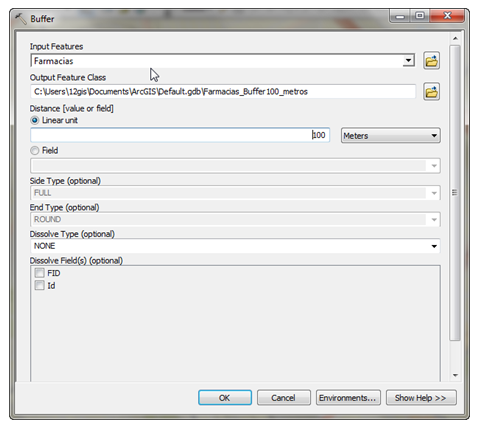
It looks like a simple tool and actually it is. We can specify each parameter to run this tool. The result is the following diagram:
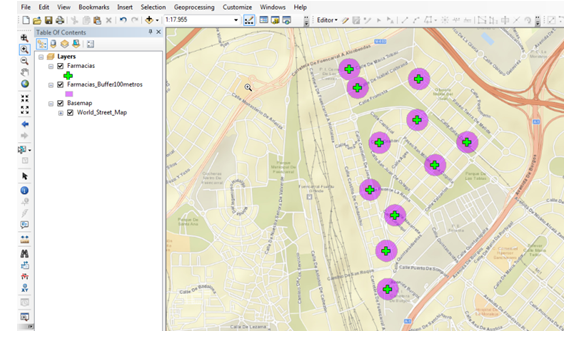
We have created a 100 meters area around each pharmacy.
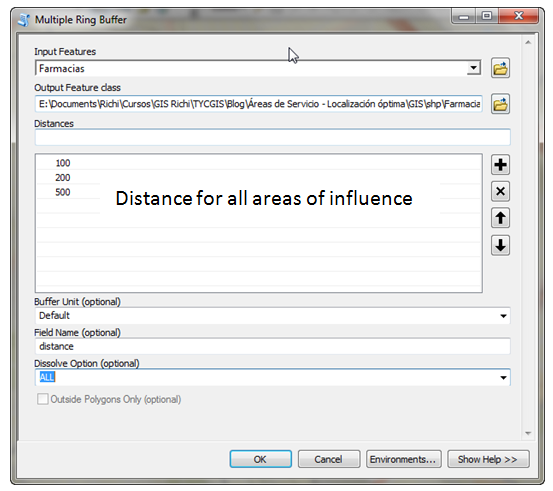
ArcGIS also has a special tool, called Script, with a different symbol as the Tool one, and it is called Multiple Ring Buffer. It allows us to calculate more than two areas of influence around a feature.
As we did with Buffer tool, we also configure this tool.
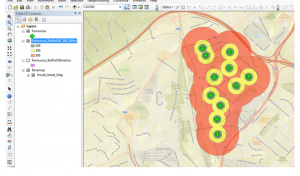
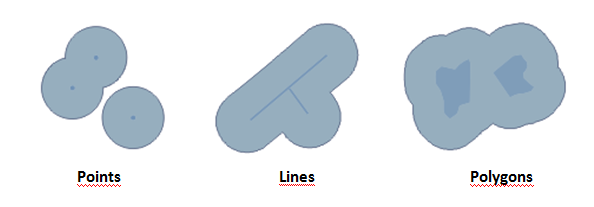
Both analysis are based on euclidean distance from the center of the location (or line), and the tools generate a polygon with the same shape as the input locations (see the following diagram).
What if we have to do more complicate analysis? For a whole city, which has a complex street or road network, we have to use the Network Analyst extension in ArcGIS. This provides an exhaustive analysis of streets based on time travels, impedance, speeds, etc.
To use Network Analyst, we have to own network data of roads (represented by lines) and create a proper network in a Geodatabase, this means, create rules and policies that connect every line and give them properties in an ArcGIS database.
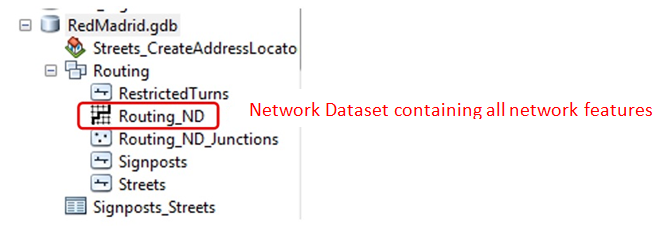
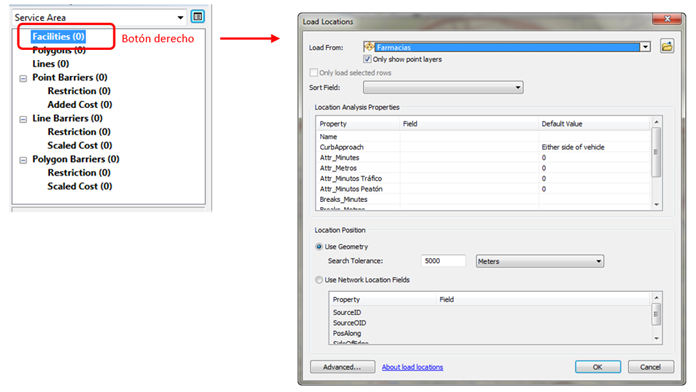
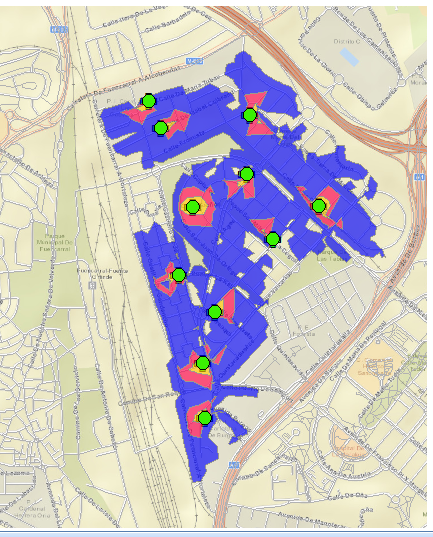
Once the Network is created (and stored in a Network DataSet) we can load our pharmacies layer and know their area of influence in 3, 5 and 7 minutes from them by walking. We use the Service Area Analysis (in Network Analyst extension toolbar).
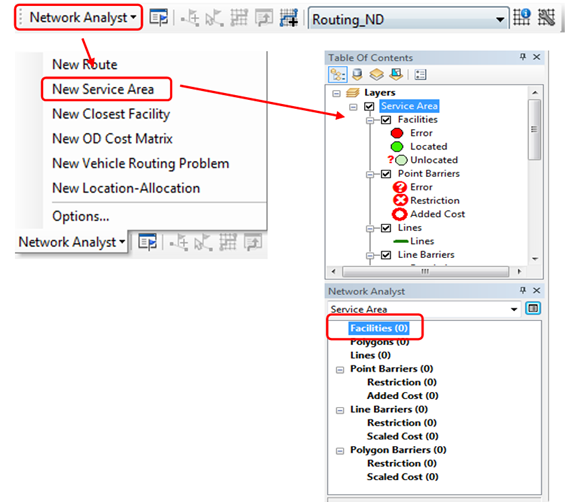
“Facilities” layer is our point layer: Pharmacies.
We configure, in Layer Properties window > Analysis Settings tab all kind of restrictions in the network.
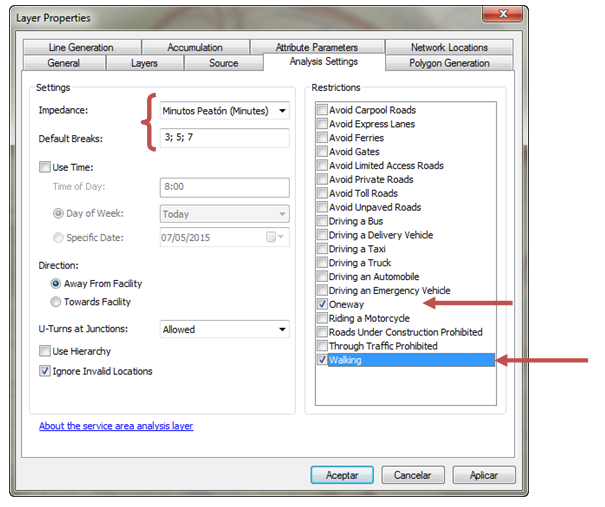
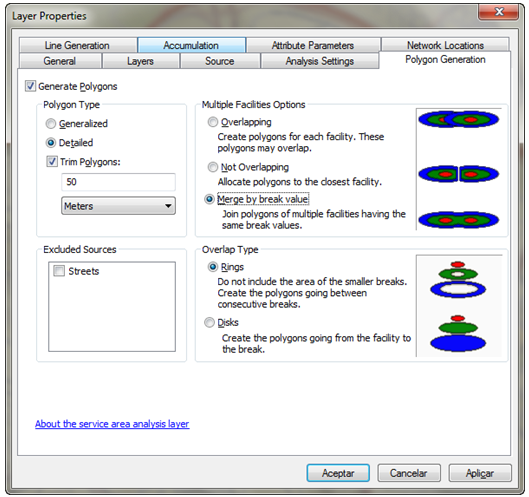
Finally, in Polygon Generation tab, how the output polygons will represent the area of influence.
Accept.
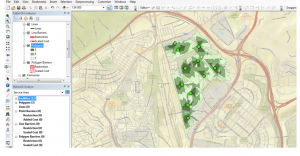
This analysis is a better representation of the real influence of this pharmacies, because the analysis is based on a real network now, and not on the whole area.
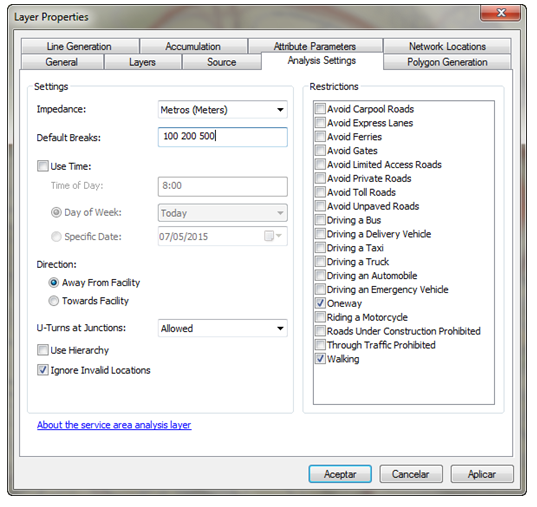
For distance analysis, we only have to change “Impedance” and “Default Breaks” every time we have the impedance configured in our network.
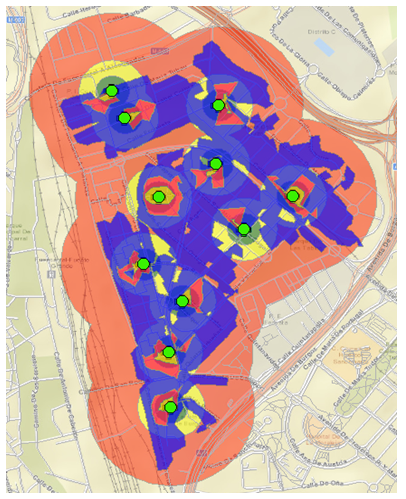
The following diagram shows every analysis executed.
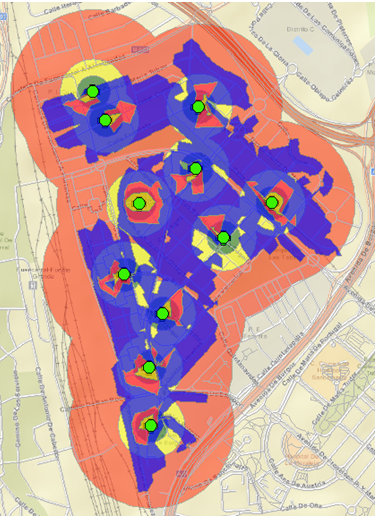
Compare the orange and yellow area (simple buffer) with the network analysis. We can see, for instance, that the blue area (distance area) is “stopped” due to the railway and the road.
To sum up, we consider Network Analyst a real territorial access study. Remember that first, we have to have a road map (group of lines).
This is an example of a group of courses of ArcGIS and Network Analyst.
Quality training taught by professionals
RECOMMENDED COURSE


hello
how can I measure the size of areas that are highlighted by service area analysis .or how can I see it
You can calculate the areas in the attribute table of the layer. Create a new field and use Calculate Geometry.