Today we will demonstrate how to apply ArcGIS 10 in wildlife and vegetation sampling for environmental surveillance, environmental impact studies, scientific studies, etc.
In previous posts we saw how to create a fishnet grid based on coordinates (click to read Creating a fishnet grid using ArcGIS 10). Using this, together with the spatial join tool of ArcGIS, we can easily generate a fishnet of samples to indicate the number of located specimens in each grid.
Let´s start working!
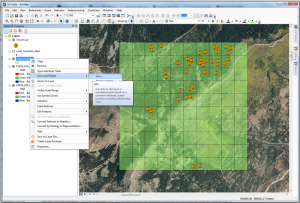
In the first place, we need a shape with the grid and another one with the points where we located the individuals on the field. From here on, we will create a Spatial Join on the grid layer.
Right click the grid layer in the Table of Content to select Join and relates> Join…
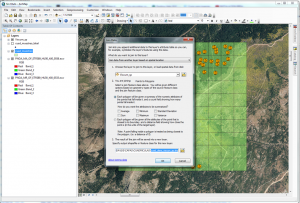
The Join dialog box will open and in the first box, where they ask us: “What do you want to join to this layer?”, we indicate a join based on spatial location. Fill in the rest of the options as follows:
- Point 1: indicate the point layer with the individual´s location.
- Point 2: choose the first option “Each polygon will be given a summary of the numeric attributes of the point fall inside and a count field showing how many point fall inside it”, and do not select any summarized options.
- Point 3: indicate where and how we want to save the layer.
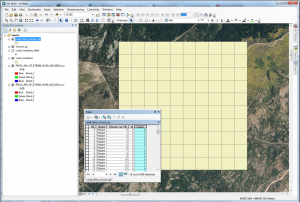
The generated layer will be just as the grid, but when opening its table of content we will see at the end a new field “Count”, that indicates the number of points that each fishnet grid contained.
Working with the symbology (Quantities type), adding labels or tags, and adding some transparency the result will be as follows:
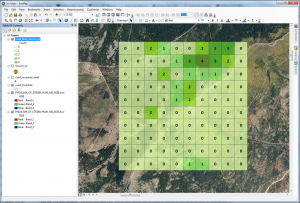
This is just an example of the multiple applications that ArcGIS has in for environmental studies.
Quality training taught by professionals
RECOMMENDED COURSE


Leave A Comment