The Semi-Automatic Classification Plugin version 6.0, updated and designed to work with QGIS 3.0 has a new cool main interface, new tabs and intuitive design.
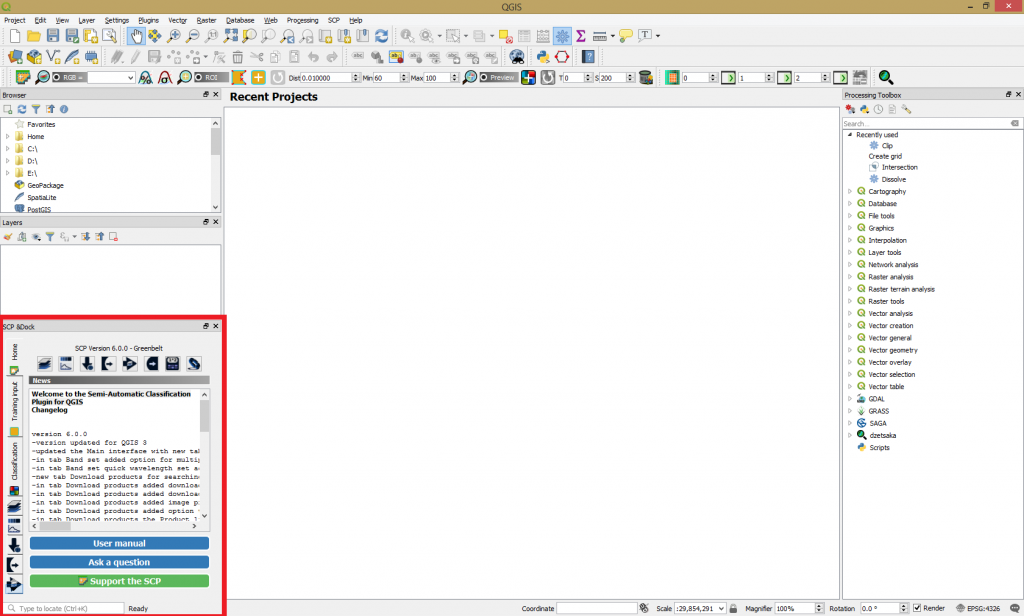
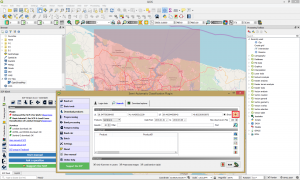
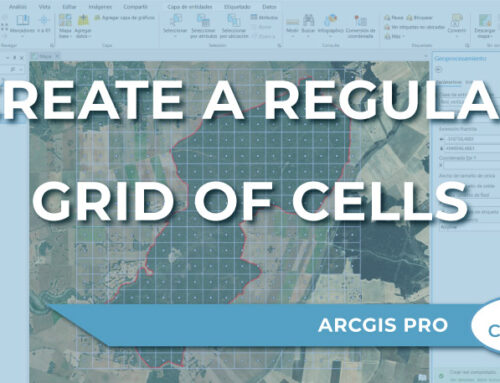
In order to start working with satellite data and realize operations like download satellite data, preprocessing, band processing, postprocessing go to any of the following buttons as highlighted in the following image.
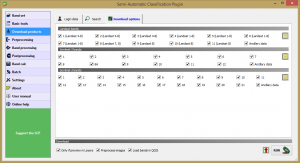
In order to download images go to Download products, insert the Login data, Search area and Download options.
NOTE: In order to define a search area make sure you enable the OpenStreetMap service before. As open layer plugin it is not available yet in this new version of the software, we establish a new connection with a online raster tile servers based on OpenStreetMap data. Find this data available here: https://wiki.openstreetmap.org/wiki/Tile_servers.
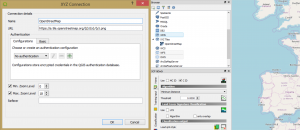
After you enabled the OpenStreetMap you can define a search area ans start downloading data.
Step 1: Login with your credentials to https://ers.cr.usgs.gov/, https://urs.earthdata.nasa.gov/ or https://scihub.copernicus.eu/apihub (depending on what kind of data you wish to download).
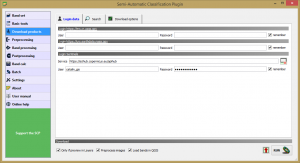
Step 2: Define a search area using the Set area in the map button.
Step 3: In the download option you will be able to select the bands desired in order to download them.
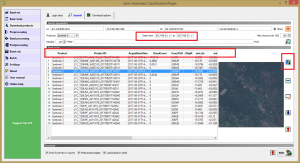
Step 4: After you set all this parameters the images will be displayed in the Product list. You can visualize the images, acquisition date, cloud coverage, etc.
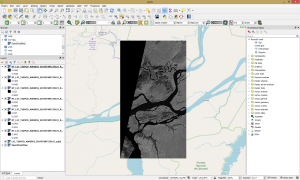
In order to perform a classification of an image, select an image and download it. Make sure you check the boxes, Preprocess images, Load bands in QGIS. Click RUN and chose a destination folder. This will load the bands you initially chose to download into your current QGIS project.
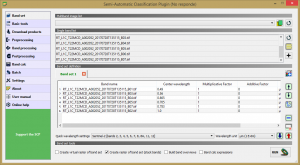
Next we will create a Band set with the bands available. Go to Band set and add selected rasters to the Band set. In the table Band set definition order the band names, this is done automatically. In the Quick wavelength settings select Sentinel 2 (in order to set automatically the Center wavelength of each band and the Wavelength unit (required for spectral signature calculation). Check the box Create raster of band set (stack bands) and then click RUN, select a folder to store the new band set.
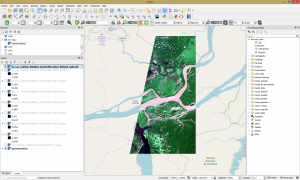
After this step you will be able to visualize the new stack layer in your QGIS project.
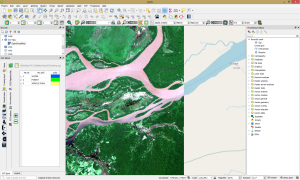
Explore the newly created raster proprieties to create different band combinations.

To start the classification of the image, go to Training input and start collecting training areas. In the SCP dock select the tab Training input and click the button  to create the Training input (define a name such as training.scp).
Next, we are going to create ROIs (training areas) defining the classes identified in the image. ROIs can be created by manually drawing a polygon. In order to create manually a ROI, click the button  in the Working toolbar.
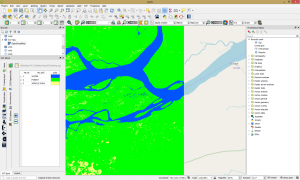
After you created the classes you can classify the image.
Find more info about this at the following link.
Quality training taught by professionals
RECOMMENDED COURSE


buenas gracias por la información.. pero tengo una pregunta como es el proceso para combinar bandas de imagenes landsat con el actual QGIS 3.4 ó 3.6. le agradezco su pronta respuesta.