Sometimes when you find yourself in need for some spatial data like, roads, buildings, waterways, etc. you can check the OpenStreetMap Database. Maybe you will find something there. This can depend on your location.
But if you want also to visualize, manage and analyze your data you can use the QGIS software and its QuickOSM plugin.
With the QuickOSM plugin, you can download OSM data thanks to the Overpass API. The Overpass API acts as a database over the web: the client sends a query to the API and gets back the data set that corresponds to the query (for more information check the next link https://wiki.openstreetmap.org/wiki/Overpass_API).
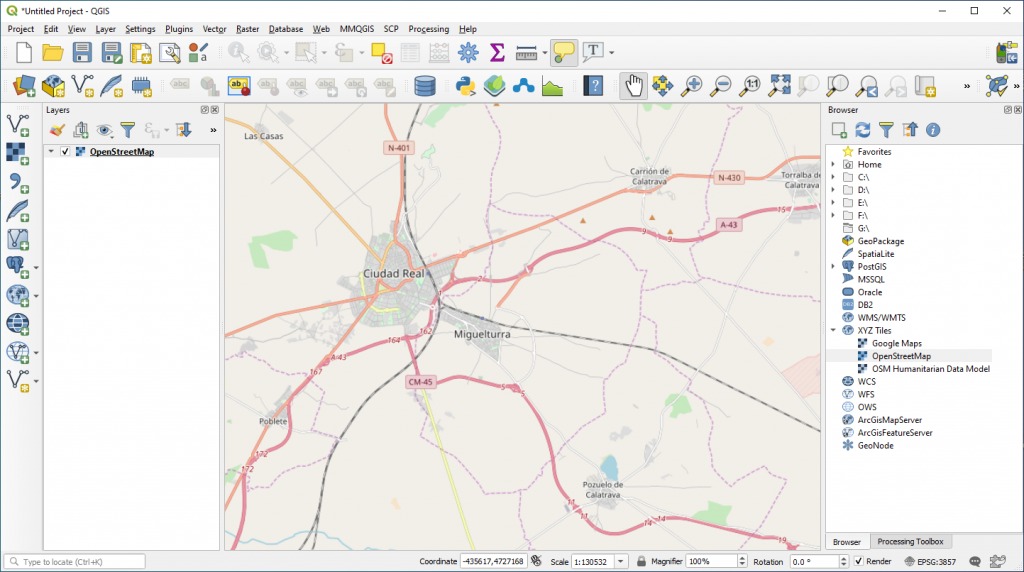
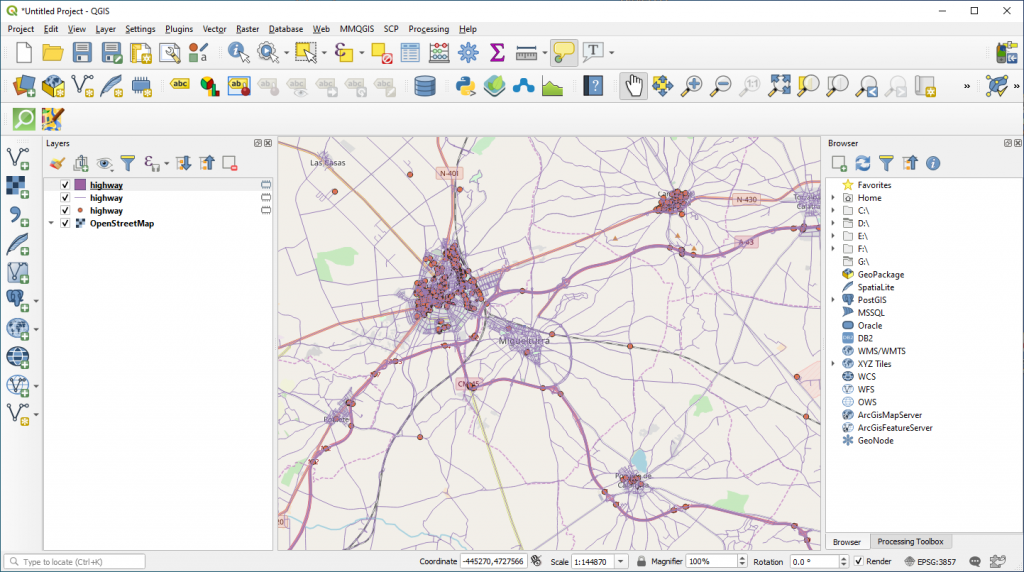
In QGIS first of all you need to bring into your map canvas the OpenStreetMap Basemap. Then zoom in to your area of interest. In this exercise we choose an area south of Madrid City, around Ciudad Real.
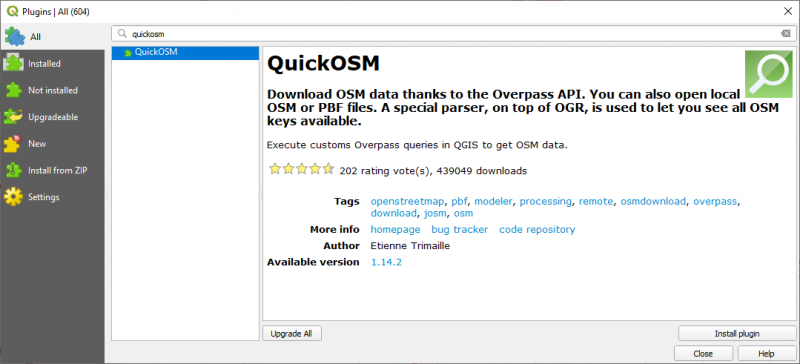
In the next step we will proceed and install the QuickOSM Plugin. Go to Plugins > Manage and Install Plugins. Type OuickOSM in the Search Box and Install Plugin.
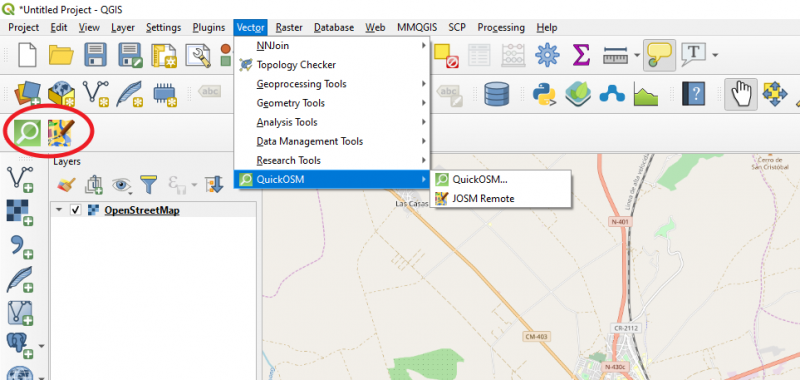
Go to Vector > QuickOSM to check if the plugin was installed correctly. You can also access the QuickOSM plugin by activating the QuickOSM Toolbar.
A new window will open. Here you need to select the Key – in our case we will select the highway key as we want to download the roads network of the zoom in area (Ciudad Real City).
the Value – subdivisions of the Key. In order to download all we will leave the first option selected (Query on all values).
the Limits of the download area – in our case we will select the Canvas Extend. This means that all OSM objects with the key “highway” in the Canvas Extend will be downloaded.
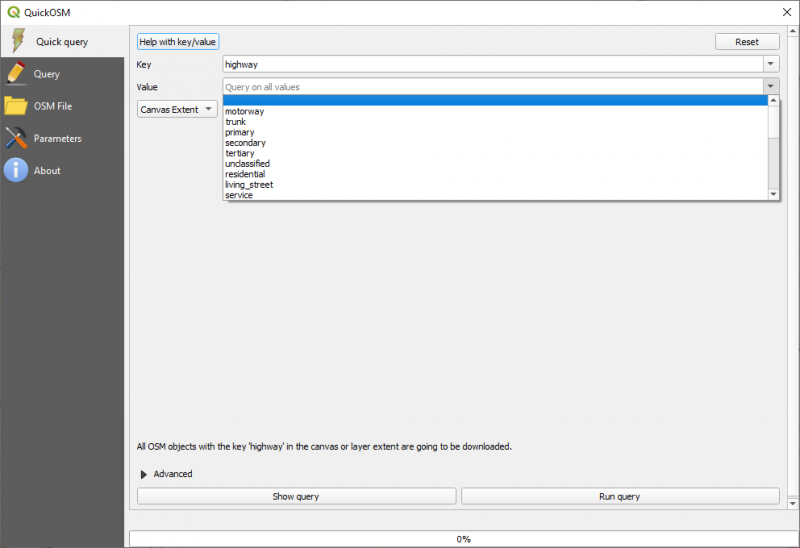
Click on Run Query.

The Query was successfully and you will receive a message. 3 layers have been loaded into your QGIS map canvas.
Deactivating the OpenStreetMap basemap we can observe better the layers just loaded.
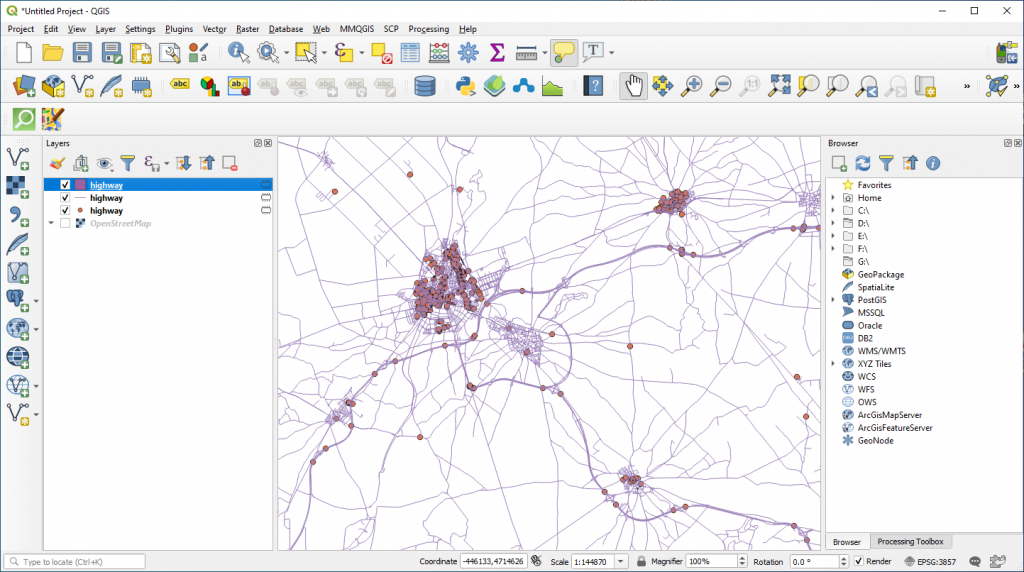
3 layers (point, polygon and line type) are loaded. They represent elements related to the “highway” key such as: pedestrian areas (as polygon features), traffic signals, crossing points (as point features) and roads (as line features). Check their Attribute Table.
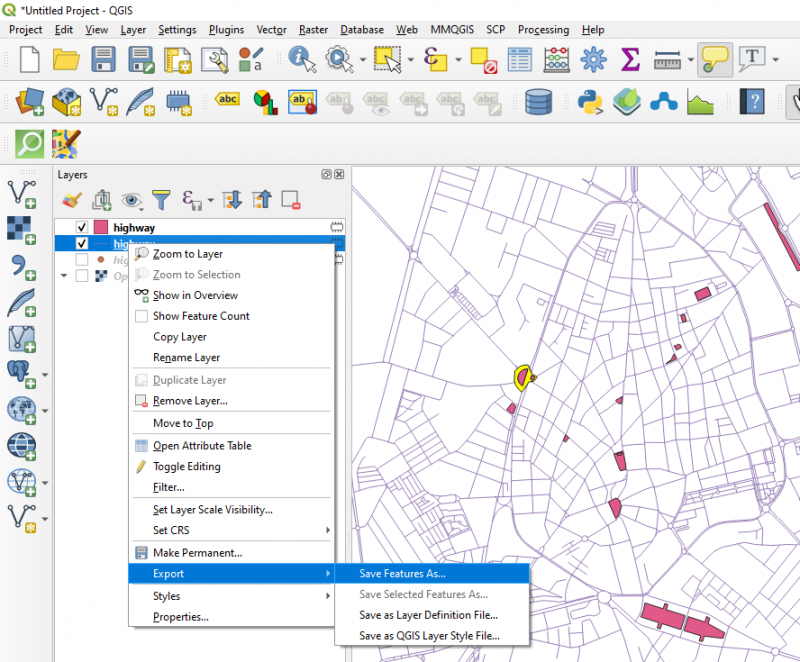
NOTE: These layers are temporary ones. In order to save them into your computer you must export them and save them.
Now you have a set of data which will help you in your future GIS analysis.

 (5 votes, average: 4.20 de 5)
![]() Loading...
Loading...
Quality training taught by professionals


hi,
I am trying to do this tutorial, however after I run the query it says “overpass API: download failed: connection timed out”.
I have changed the timeout to 300 but it still does the same thing.
Any idea what is happening?
Thanks, Brad
Nice article
Thanks for sharing such a helpful article.
Well understood