In this tutorial we will learn how to download, pre-process and manage satellite imagery. All this using the open source software QGIS and the Semi-Automatic Classification Plugin (SCP). This is an easy exercise everyone can practice. The Semi-Automatic Classification Plugin (SCP) provide tools for the download, the preprocessing and the postprocessing of remote sensing images.
First of all, you need to have the QGIS software installed on your computer. After this you can install the Semi-Automatic Classification plugin using the Manage and Install Plugins option.
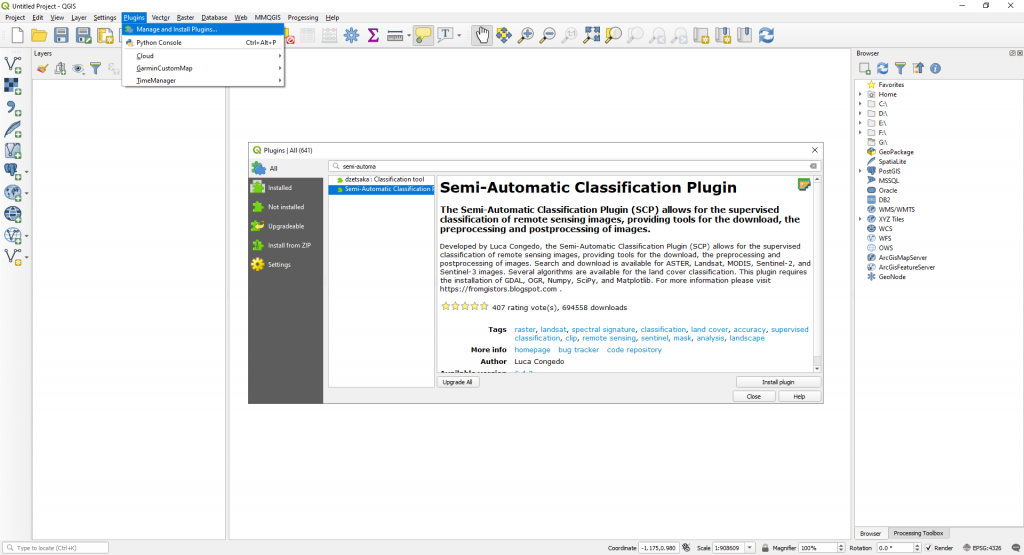
The Semi-Automatic Classification Plugin will be installed. Two toolbars and a Panel will be added to your QGIS Graphical Interface. You can find more information about this by reading the User Manual of the Semi-Automatic Classification Plugin.
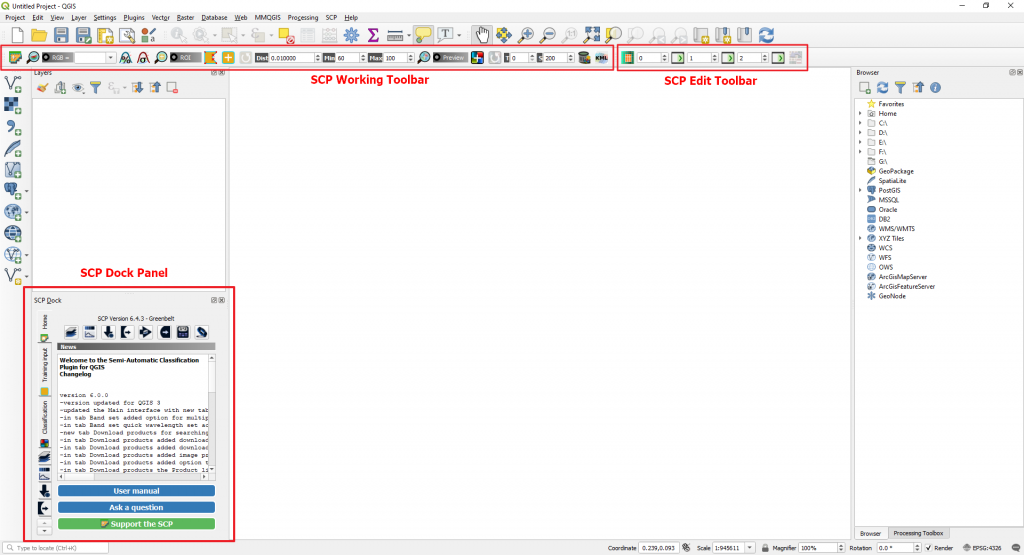
In this exercise we will use the Working Toolbar from where we can access the Main Interface Window.
![]()
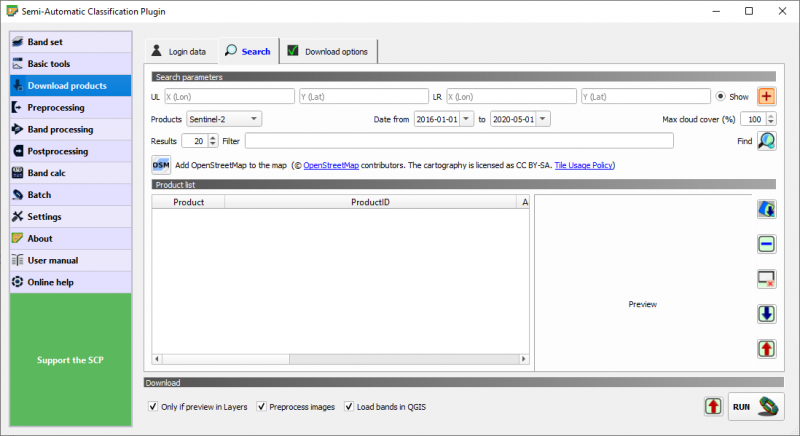
The Main Interface Window is composed of several tabs. We will go and click on Download Products. But in order to be able to download products we need to provide some Login credentials.
Next, go to the Login data sub-tab. Here you will need to fill in the login information (depending on what kind of data you want to download).
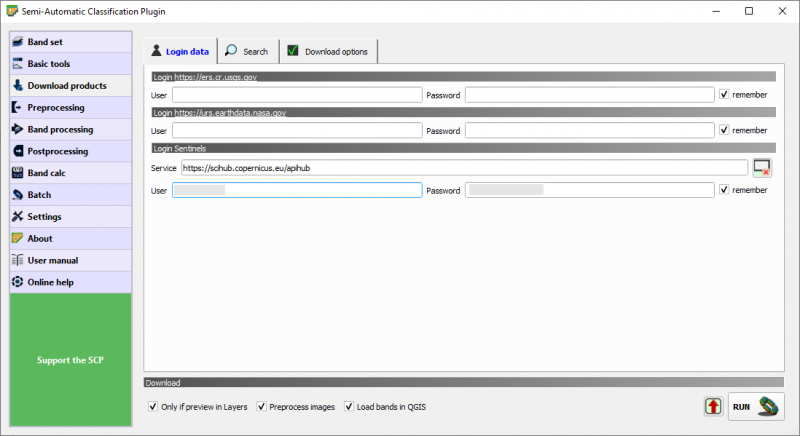
For example if you want to download Sentinel 2 satellite images you will need to fill in the Copernicus Open Access Hub credentials – https://scihub.copernicus.eu/dhus/#/home.
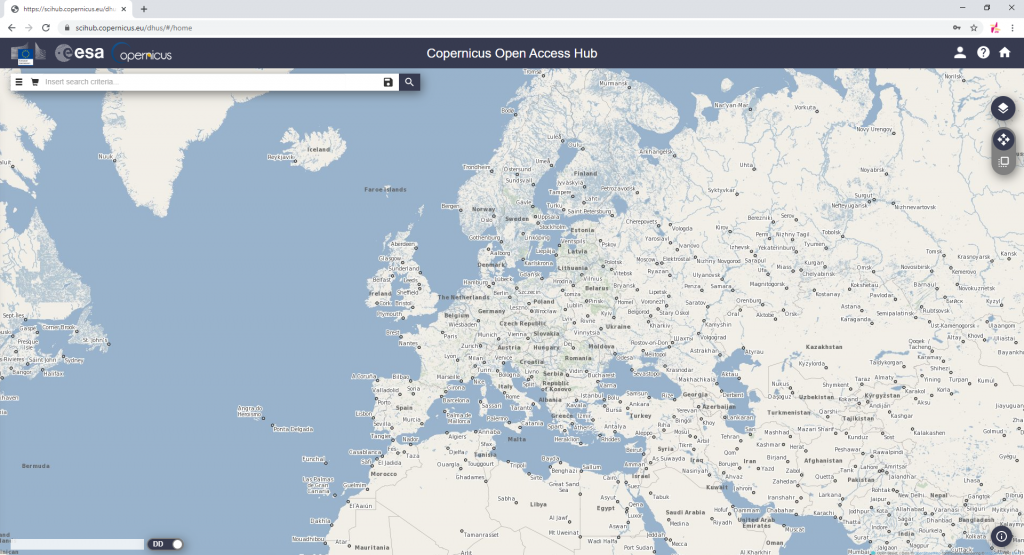
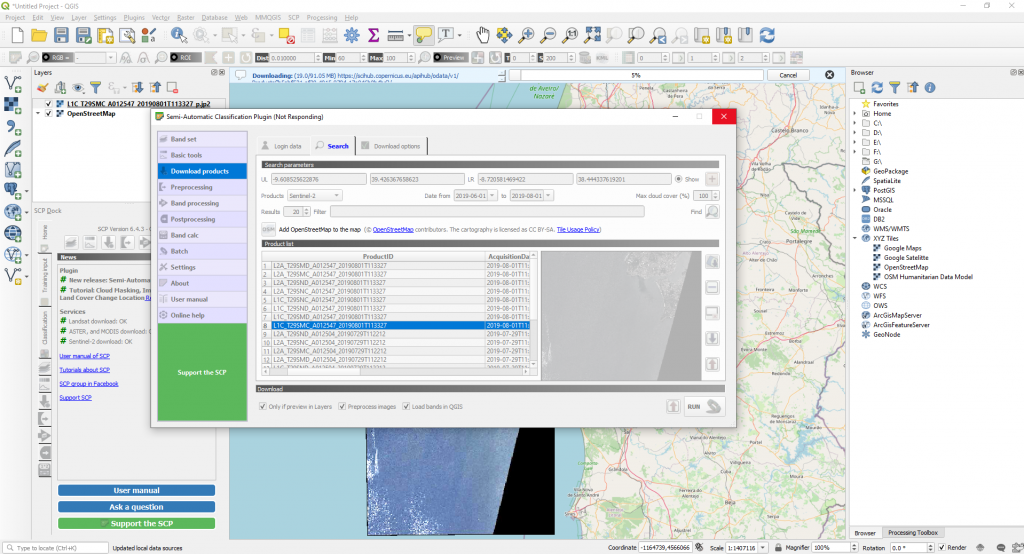
If you do not have an account you need to create it. After this step is completed, go to Search sub-tab. Meanwhile in the QGIS map canvas, add the OpenStreetMap Basemap. If you encounter difficulties in adding the OpenStreetMap Basemap you can find some information here – https://www.giscourse.com/how-to-add-openstreetmap-basemaps-in-qgis-3-0/.
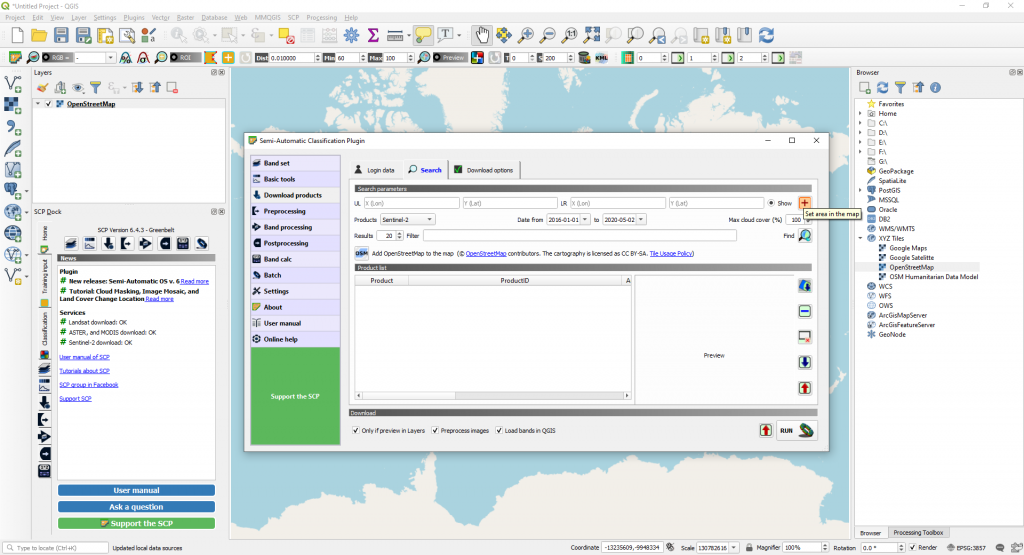
You can add the OpenStreetMap in the map using the OpenStreetMap button in the Semi-Automatic Classification Plugin window.
![]()
After the Basemap is added, in the Search sub-tab, go to the Set Area in the map button (red cross on a orange background) and select an area of interest in the map. Use the left click and then the right click to draw a rectangle.
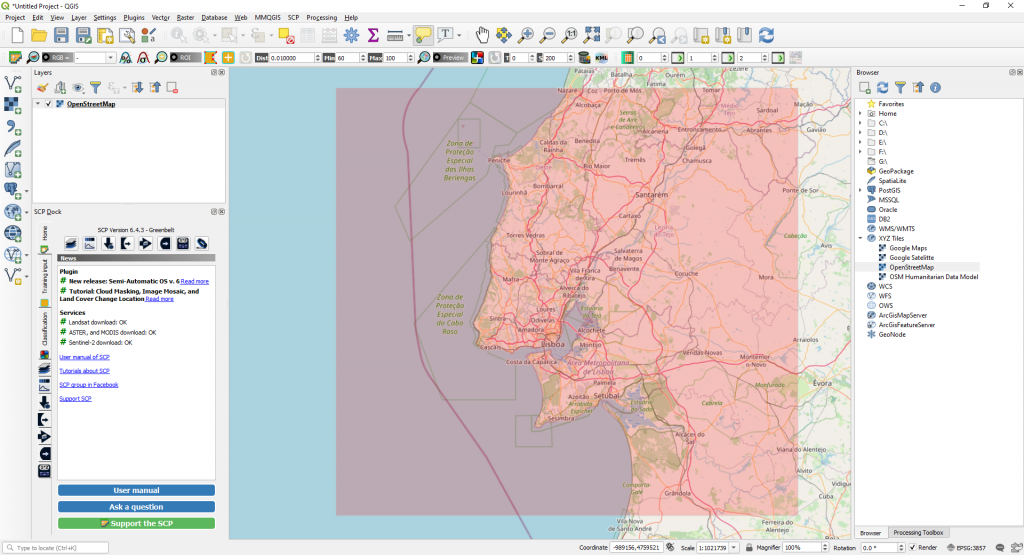
We will download a Sentinel 2 image around the city of Lisabona, Portugal. After the rectangle is drawn, select the time interval you are interested in and click on Find button.
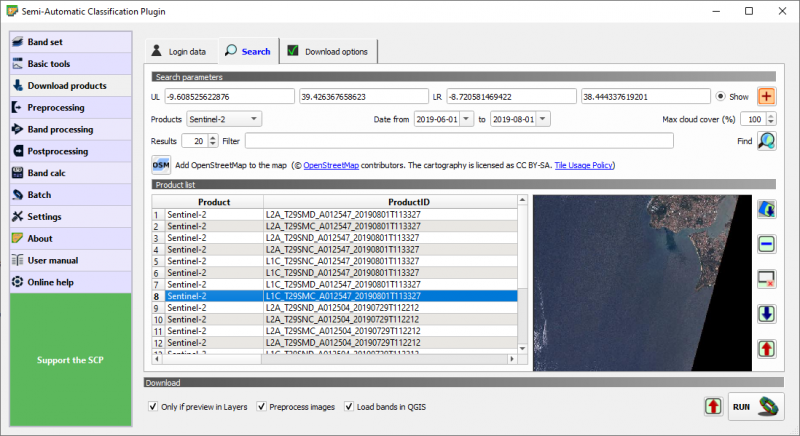
In the Product List, all the available images, form the period of time selected will appear. Next, we will select the image which suits us and Click on Run. But before that, make sure you check the
- Preprocess images (checking this box will end up in converting the data to surface reflectance). More information can be found in the Semi-Automatic Classification Plugin user manual (page 146) – https://readthedocs.org/projects/semiautomaticclassificationmanual/downloads/pdf/latest/.
- Load bands in QGIS
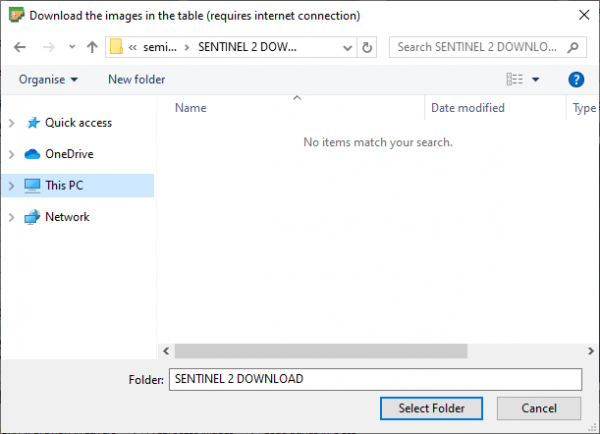
Now, you can click on Run. Select a folder to download the image and click Select Folder.
The download will start. If your download will not start keep trying until it starts.
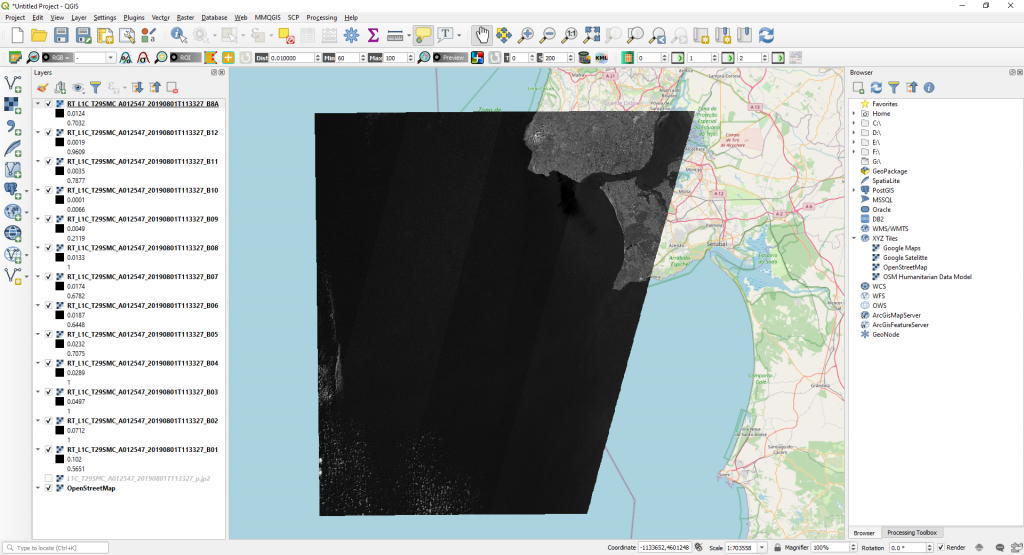
After the download is complete, all the Sentinel 2 bands will appear also in the Layers Panel.
Next, we will create a virtual raster (a mosaic of the list of input GDAL-supported rasters). This means that we will merge all the bands to a single raster (which will be considered a multiband raster).
Go to Raster > Miscellaneous > Build Virtual Raster….
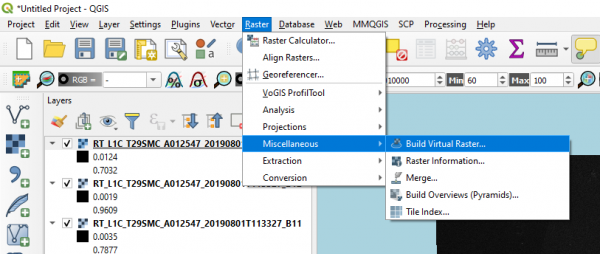
In the new window, in the Input Layers, select only the bands that have a 10 m Spatial Resolution (band 2 – blue, 3 – green, 4 – red and 8 – NIR). For more information about Sentinel 2 bands and their spatial resolution check the next link https://en.wikipedia.org/wiki/Sentinel-2.
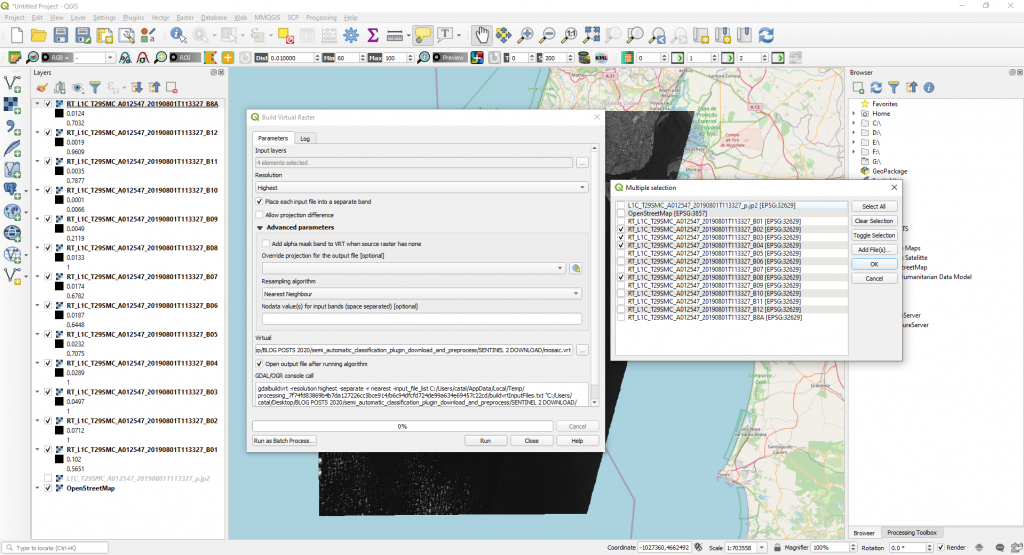
Select a new name and location for your new mosaic. Click Run.
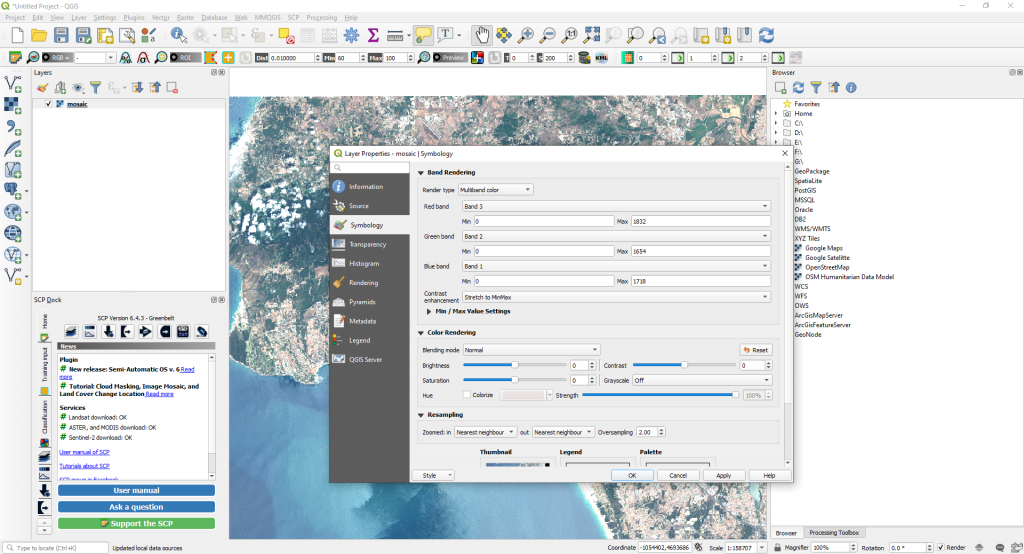
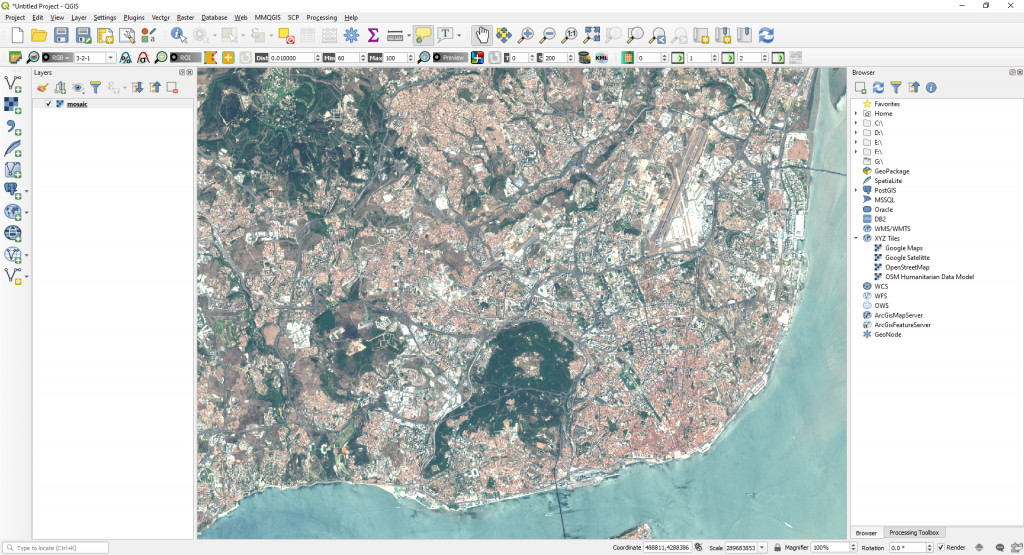
Open a new QGIS project and add the newly created raster. Symbolize it as: Render type – Multiband color (RGB – red – green – blue) – (Red Band – Band 3; Green Band – Band 2; Blue Band – Band 1). This is also called Natural Colour Composite.
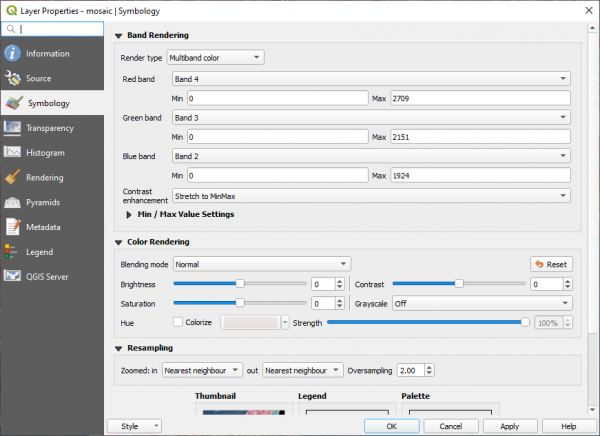
You can change the color composite to a false one (NIR – red – green). In the Layer Proprieties window will be (Red Band – Band 8 NIR; Green Band – Band 3 Red; Blue Band – Band 2 Green).
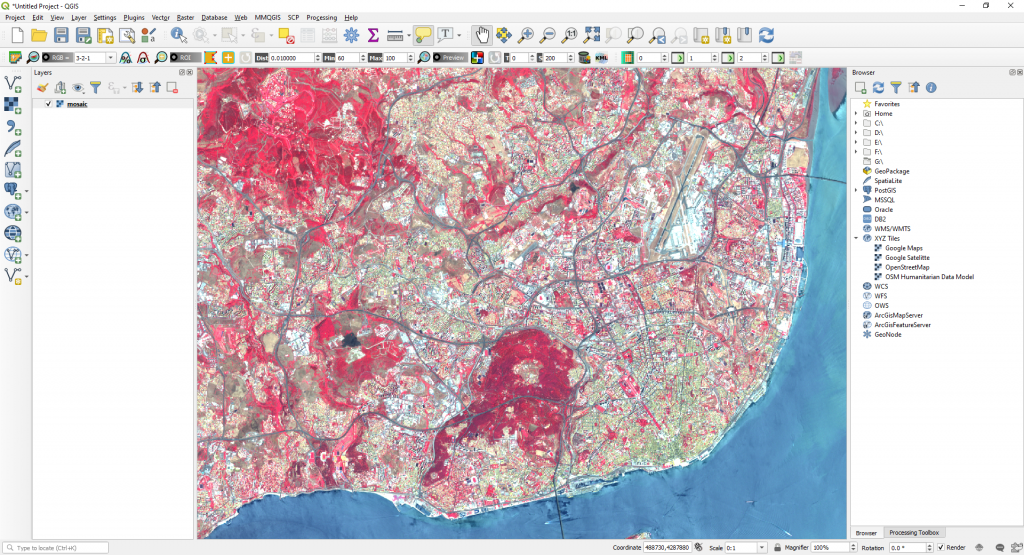
Source: Congedo Luca (2016). Semi-Automatic Classification Plugin Documentation. DOI: http://dx.doi.org/10.13140/RG.2.2.29474.02242/1

 (4 votes, average: 4.00 de 5)
![]() Loading...
Loading...
Quality training taught by professionals


Leave A Comment