If you have two raster’s (digital elevation models) of the same area but they are displaying the area in two different moments of time, it is possible to fill up the space between them and obtain valuable data about the differences that occurred in time or due to an anthropic activity, for example a mining activity.
In this exercise we will evaluate the impact of a mining activity over the digital elevation model of an area, evaluate the mining activity reservoir and explore the data in a 3D way.
For data manipulation and handling we will use ArcGIS Desktop tools, ArcMap and ArcScene.
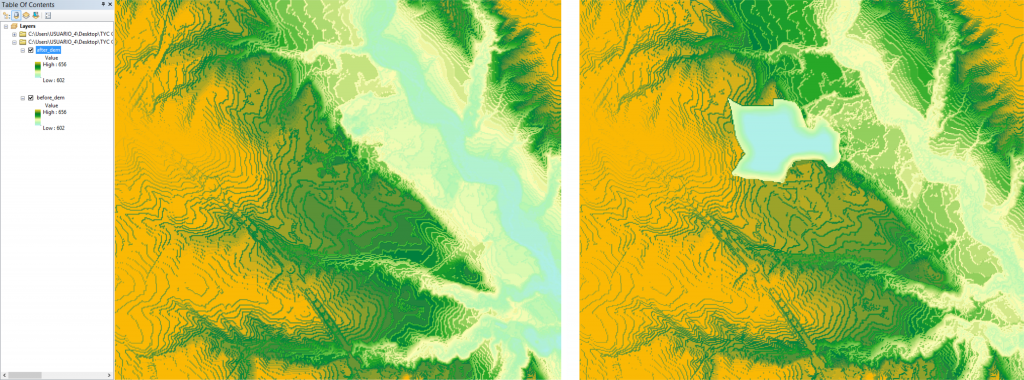
Step 1. Open your DEM data in ArcMap and display your data before and after the mining activity begun. The diferences that ocurred in the area after the mining exploatation can be visualize in the following image.
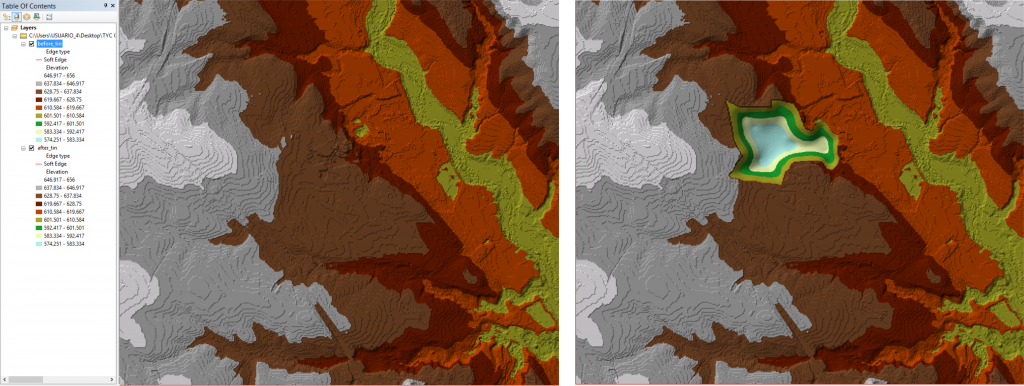
Step 2. In order to perform the difference operation between these two rasters and for a better visualisation of the data in 3D we will convert the rasters to TIN data. In order to do that go to 3D Analyst > From Raster > Raster to TIN. The TIN files obtain should resamble the image below.
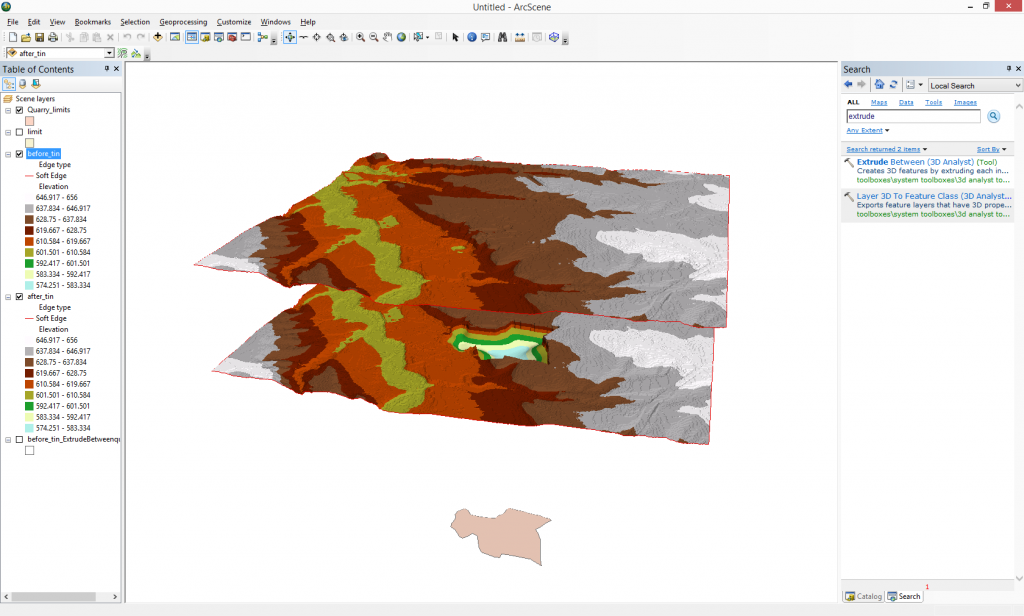
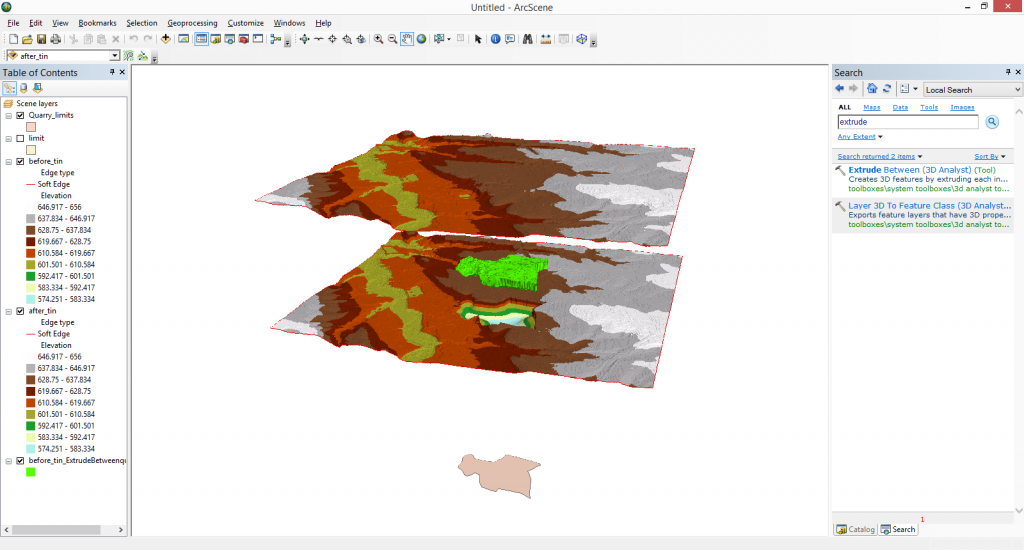
Step 3. Open the TIN data in ArcScene.
3.1 Go to Scene Proprieties and set a vertical exagerration for both layers.
3.2 Go to Layer Proprieties and chose a layer offset for a better visualisation.
3.3 Open the vector layer which delimitate the mining activity (the quary).
The data should display like in the image below.
Step 4. Fill up the space between them and obtain valuable information about the impact of the mining activity over the digital elevation model.
4.1 Go to 3D Analyst > Extrude Between
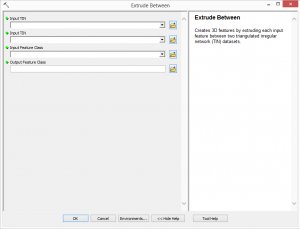
4.2 Fill up the parameters (the two TINs and the quary limit in order to delimitate the difference results to the mining activity).
The result coresponds to the mining reservoir (the amount of material that has been escavated from the quary).

Quality training taught by professionals
RECOMMENDED COURSE

Leave A Comment