As you already know, last Wednesday April 22 was the international Earth Day. This is a special day dedicated to remember all the things that our mother Earth is giving us every day, and how important it is to preserve this patrimony.
During Earth day, the entire world supports the environment, this year under the motto “It´s our turn to lead”. Also this year is the 45th anniversary of this celebration and so 2015 could be the most exciting year in environmental history.
Now we are going to show you some interesting maps commemorating Earth Day.
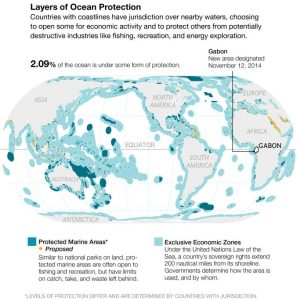
WORLD´S PROTECTED SEAS
After Gabon (Africa) and the U.S announced new protected marine areas in its nations, National Geographic, along with the collaboration of key partners, has created the first map that represents the protected seas around the world.
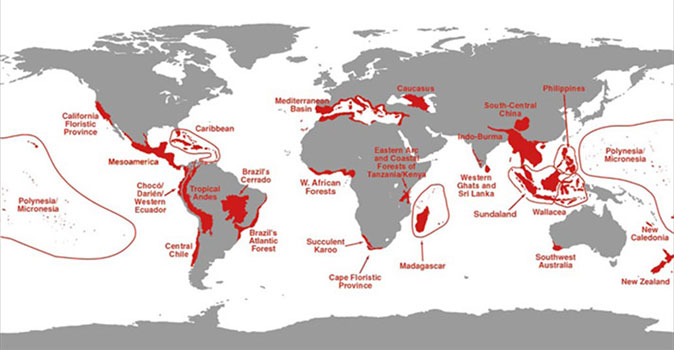
HOT SPOTS IN THE WORLD
This map indicates the principal biodiversity hot spots around the world. As we can see, the most areas rich in are the tropical and subtropical, and East Asia has the biggest concentration of hot spots.
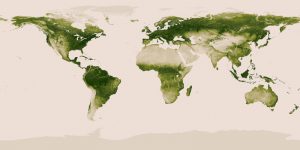
WORLD´S VEGETATION MAP
Here we can see the vegetation distribution in the world. As we can observe, the highest concentration is in the Amazon, North of Europe, North-Est of USA and Canada, and the Philippines Islands.
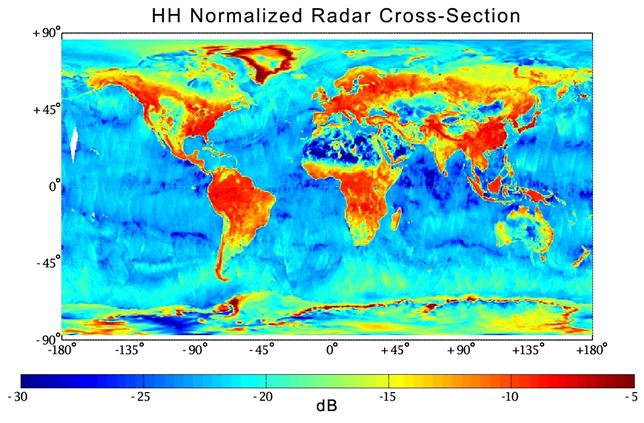
FIRST GLOBAL MAP OF HUMIDITY IN THE SOIL
This image is taken by the SMAP satellite. In the extreme latitudes it also detects if the water contained in the soil is frozen or not or not frozen. The Soil Moisture Active Passive (SMAP) ship will be very helpful for the scientists that are studying the link between the water cycle, energy and carbon in the Earth.
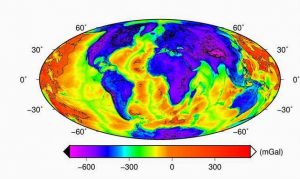
MAPS OF GEOTHERMAL ENERGY
This is an image from an online tool created by scientists of ESA (European Space Agency) and IRENA (International Renewable Energy Agency) from GOCE (Gravity field and steady-state Ocean Circulation Explorer) satellite gravity data to indicate the areas that could have geothermal potential. Maps from this tool can help in the research of geothermal reservoirs, and give us more information about volcanic activity.
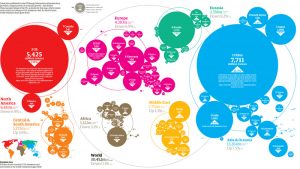
ATLAS OF POLLUTION
The Atlas of pollution is an interesting map that represents the world in carbon dioxide emissions. As can we see, the biggest country is China followed by the United Sates. In this terms, Asia is the main continent emitting carbon dioxide.
Quality training taught by professionals
RECOMMENDED COURSE


Leave A Comment