One main feature for a person who is starting to study Remote Sensing and GIS sciences, is to know how to download the most useful data for his corresponding study area. Getting to know the scales and resolutions that better fixes to that area, downloading the necessary features… and so on, we will cover them in this post.
We can obtain data from different types of satellites. The European Space Agency carries out many projects to collect images of the Earth continuously.
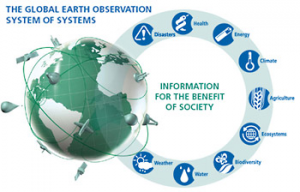
One of the newest projects is the called “Copernicus”. The first satellite taking part of this space project was launched in 2014, and the next one in 2015. It is expected to build a satellite system composed by six of these machines, taking every time images of the Earth, and join this data to the GEOSS (“Global Earth Observation System of Systems”) system.
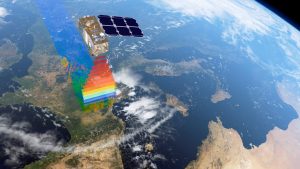
We are going to search for the most updated data provided by Sentinel-2A. It renews its images by taking multispectral photos every five days, with a resolution of 10 meters. All the published data is accessible to everybody.
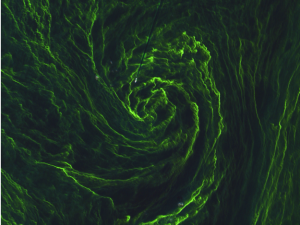
The next high-resolution sample image, which represents the bloom of seaweeds in the Baltic sea, will show us one of many applications of this public data taken by satellites. This will lead us to know (almost in real time) all the events that are happening in our oceans. This is a very precious tool to monitorise the ocean colour (you can see our post about chlorophyll data measured by contrasts).
The satellite has a camera which covers 13 spectral bands of resolution, with a 290 km wide stripe.
To download all the data provided by this satellite, ESA has created a web viewer where we can choose our zone of interest:
https://scihub.copernicus.eu/dhus/#/home
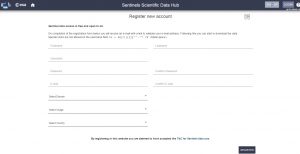
In the first place, we have to sign into the website. Go to SIGN UP and then we will fill the fields requested, such as Name, Password, Email, such as the following image:
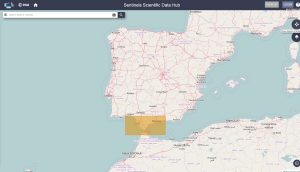
Once registered, you will receive a confirmation email. Then, we will be able to access the data. The next image represents the interface you will see:
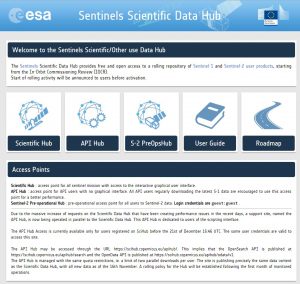
To go back to the Web Map Viewer, click on Scientific Hub, then we will be able to log into the website using our recently created account.
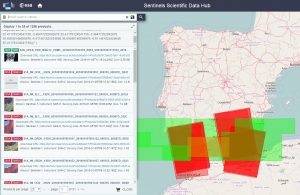
Finally, we proceed to download all the features we need for our study. We could use the “Search” browser or draw a polygon over the map in order to select the grids of image available.
For the next posts, we will learn the projects in which we can use our downloaded data, and how to execute analysis.
In TYC GIS, we are looking for new students to learn Remote Sensing in our specialized courses, made by experts. Each detail is carefully wrote to make an easy learn for the complex IT sphere!
Quality training taught by professionals
RECOMMENDED TRAINING COURSE


Leave A Comment