
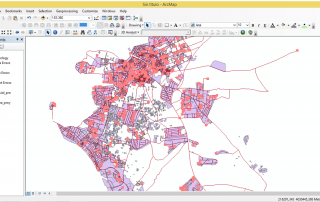
Convert ArcGIS desktop 10 data to AutoCAD Map 3D format
When working with projects in ArcGIS format, it may happen that we want to work with them, or that they need to be available, in AutoCAD format. […]
When working with projects in ArcGIS format, it may happen that we want to work with them, or that they need to be available, in AutoCAD format. […]
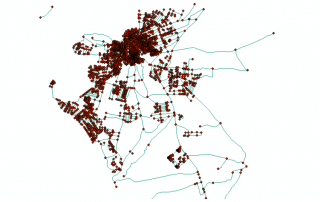
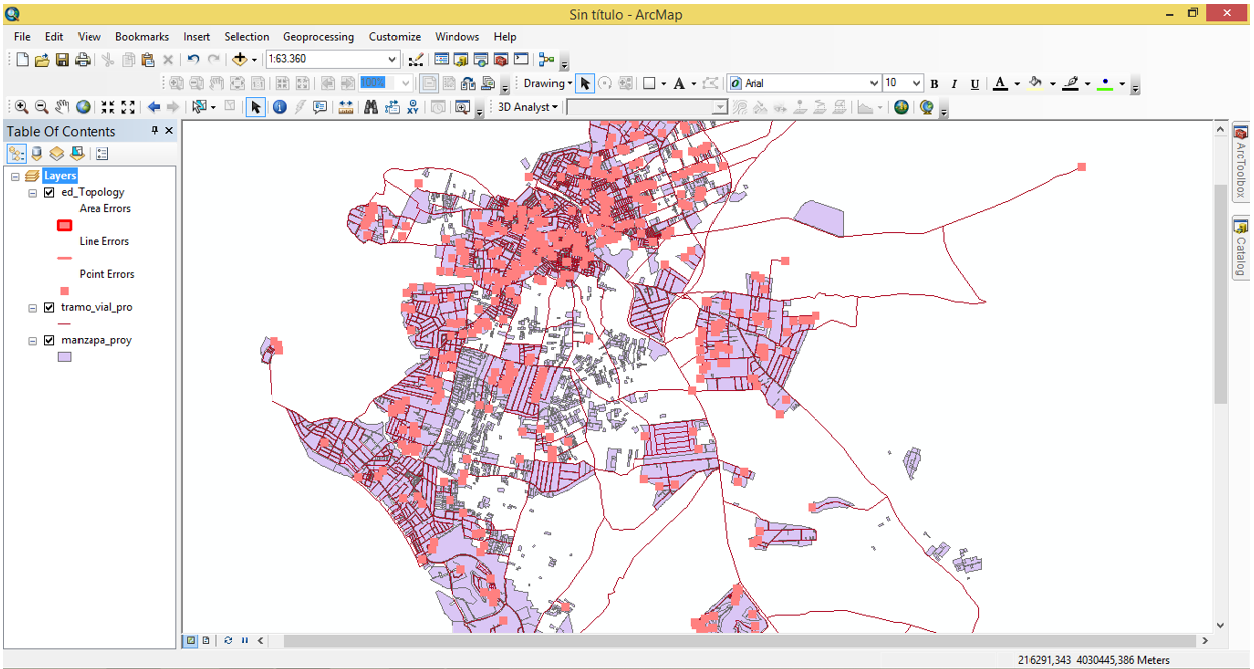
This geodatabase feature allow us analyse vector networks and find out if there are errors on them to be able to fix them afterwards. With this we can, for example, carry out a more exact analysis or create routes without finding an error. What this feature does is find errors in the layer (or group of layers) [...]
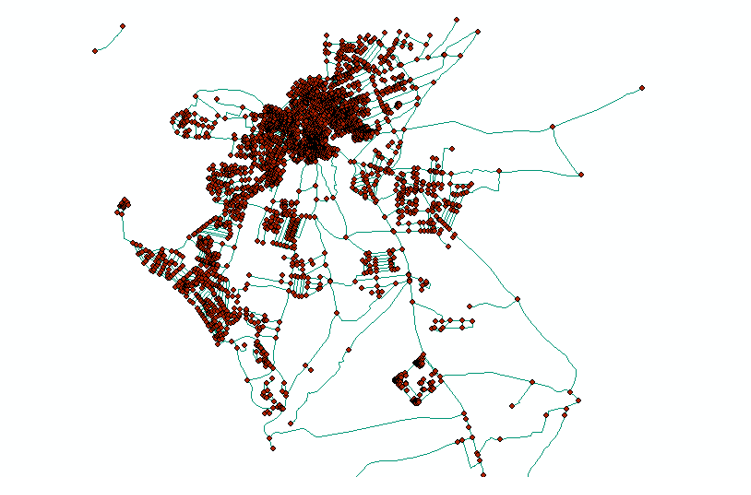
Network Analyst is a geospatial tool based in networks used to support decisions. The networks are formed by edges (lines) and nodes (points). […]
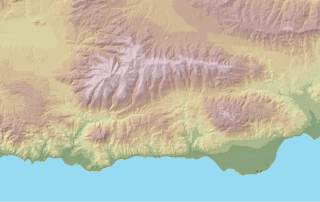
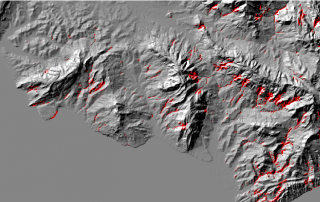
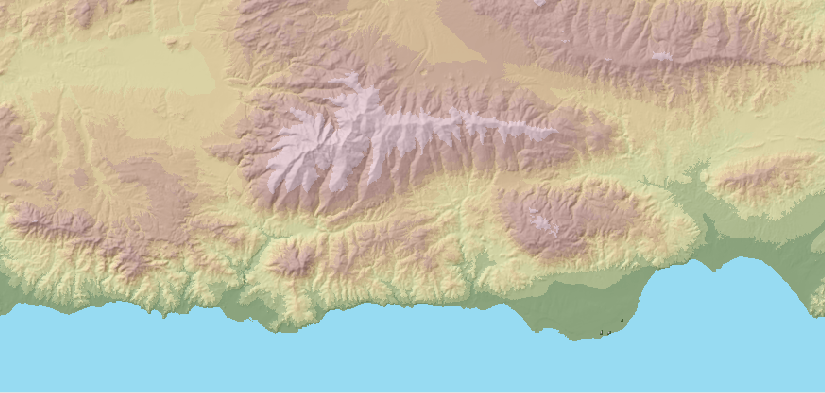
Once a project is done, it is important to create a beautiful presentation. Even though the goals have been met, it is a requirement to know how to present the results and do so in a visual way. Next, we are going to show you a trick to add relief to the image. [...]
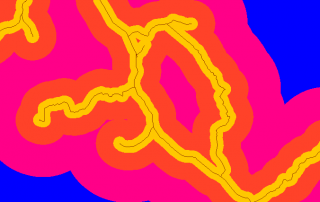
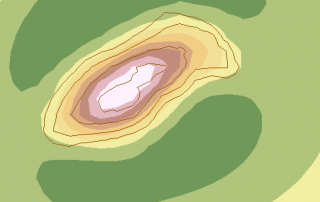
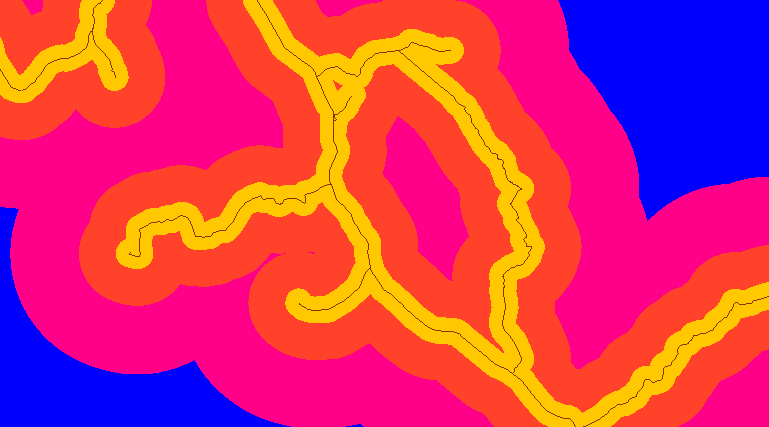
A common tool, mostly used in multicriteria analysis, is the construction of Euclidean distances. It consists in generating a raster from a vector layer or another raster that indicates the existing distances from that figure to the rest of the field in a visual and colourful way. Or said in a different way, it indicates the [...]
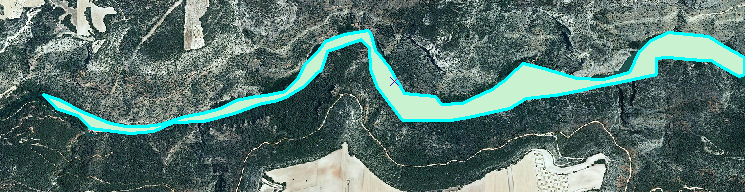
A common problem during environmental studies is calculating study areas or perimeters. If you are working with areas that are small enough so that its measure doesn’t appear anywhere, its size has to be measured manually. ArcGIS suggests a method to calculate them that depends on your precision skills. […]
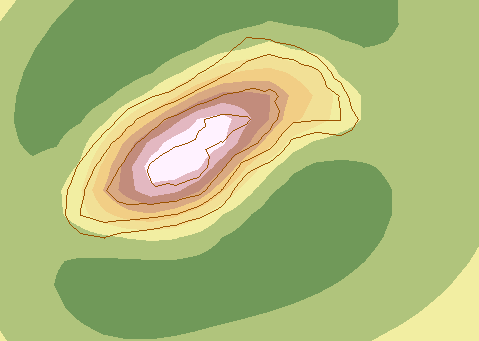
ArcGIS has numerous tools to calculate topographic elements of all kinds, including volumetric calculations. In this post, we will learn how to calculate the volume of a polygon. […]
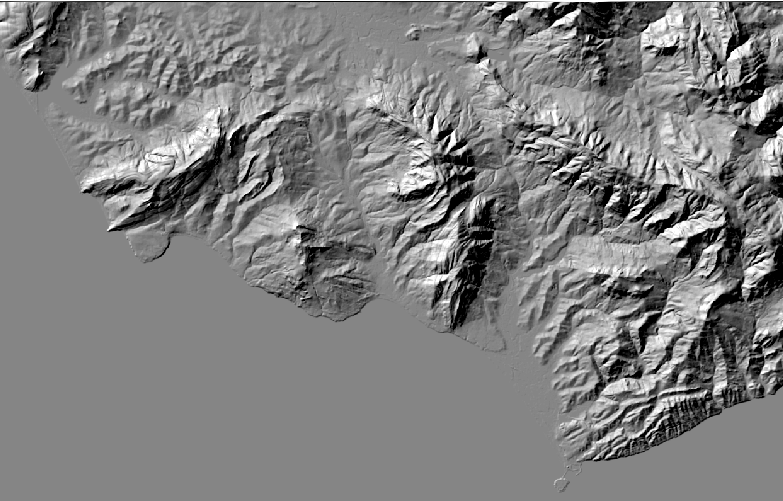
When we download a DTM raster from a web server, we obtain an image that looks like this: At first sight it is hard to appreciate the details of the image not knowing which part falls inside the map. In order to make its esthetical look seem better, we will apply a hillshade effect to [...]
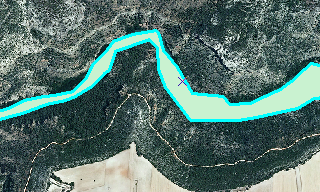
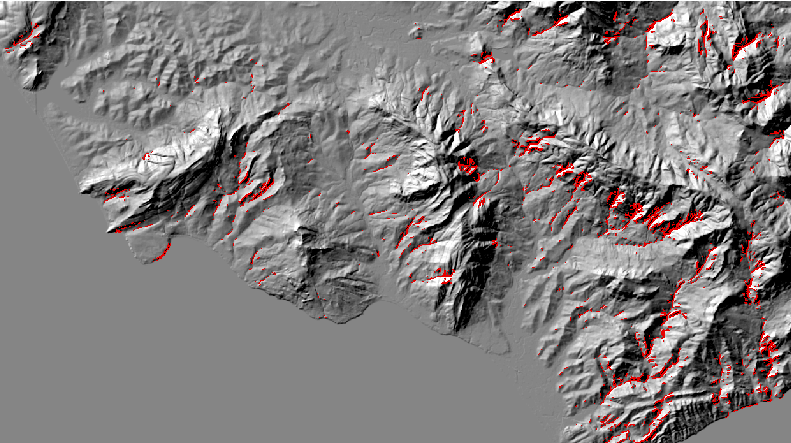
Today we are going to study the erosion risk of a terrain. With multicriterial analysis we are going to analyse the slope as well as its proximity to rivers. […]
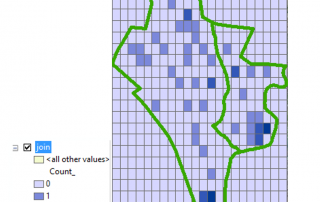
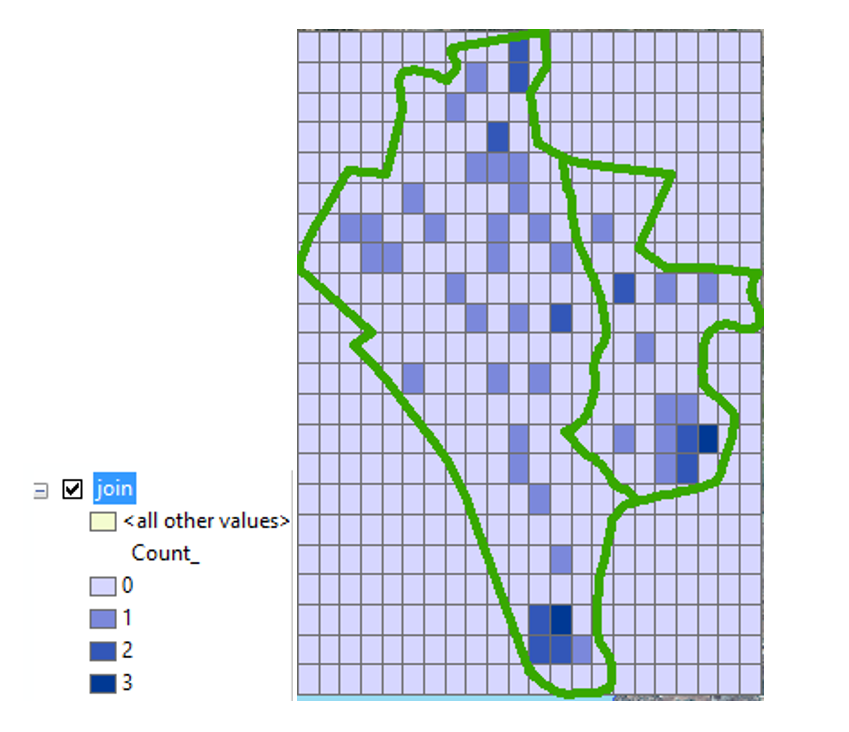
Many environmental projects need the design of presence or abundance maps in a fishnet (grid net). Following some simple steps we can represent in a grid the number of sightings of a species inside an area with colors that will vary depending on its abundance. […]
